

TikTok Shop Analytics: 8 Competitor Signals Worth Tracking

TikTok Shop analytics helps sellers understand how products generate discovery, engagement, and sales across search, recommendations, product cards, videos, livestreams, and creator content. For competitor research, the most useful signals are sales velocity, pricing, review momentum, content angle, creative cadence, creator traction, launch velocity, and recurring customer complaints.
The challenge is data quality. TikTok Shop Seller Center provides first-party performance data for a seller's own shop, while competitor revenue, order volume, and conversion figures usually come from public observations or third-party estimates. Those numbers can reveal direction, but they should not be treated as an exact copy of a competitor's private account data.
This guide explains what each signal measures, where it comes from, how reliable it is, and which decision it can support. It also provides a weekly scorecard that prevents one viral video, temporary discount, or estimated GMV spike from being mistaken for durable demand. The objective is a repeatable decision process, not a larger collection of disconnected metrics.
Key takeaway: Competitor analytics becomes useful when at least three independent signals point to the same conclusion. A sales estimate alone cannot explain whether growth came from price, creators, content, reviews, or a short promotion.
TikTok Shop Analytics Basics
TikTok Shop analytics is the collection and interpretation of sales, traffic, product, content, creator, and customer signals generated through TikTok's shopping experience. It can diagnose a seller's own performance directly and support competitor research when public observations and estimates are labeled clearly.
TikTok's official Shop Tab and Search Analytics documentation lists GMV, items sold, impressions, average daily customers, recommendation performance, and traffic sources among the available first-party metrics. Product Analytics adds product-level GMV, orders, units sold, page views, traffic sources, rankings, inventory, and pricing information. These reports are designed primarily to explain the performance of the seller's own shop and catalog.
Competitor analysis answers a different question. It tries to determine what appears to be changing in another shop, product, creator network, or content strategy. The evidence may include observable price changes, review growth, new videos, creator activity, catalog additions, and estimated sales. Each observation has a different confidence level.
Sellers researching TikTok Shop trending products should therefore separate popularity from durability. A product can trend because of a short discount or one creator spike. A stronger opportunity usually shows continuing review growth, multiple active creators, repeated content production, and stable demand after the initial spike.
Data Sources and Limits
The first step in any TikTok Shop competitor analysis is labeling where each number came from. Mixing first-party data, public evidence, and estimates in one column creates false confidence.
| Data class | Typical examples | Best use | Reliability boundary |
|---|---|---|---|
| First-party shop data | GMV, orders, units, conversion, traffic sources | Diagnose the seller's own shop | High for the account and report definition shown |
| Public competitor evidence | Price, reviews, product pages, videos, creator posts | Confirm visible activity and positioning | High for what was observed on the recorded date |
| Platform benchmarks | Category review distribution, rankings, recommendation status | Compare performance with a platform reference | High within the platform's stated methodology |
| Third-party estimates | Competitor GMV, orders, sales trend, creator attribution | Identify direction and prioritize research | Directional; methodology and coverage may vary |
| Analyst interpretation | Opportunity, risk, durability, recommended action | Turn multiple observations into a decision | Depends on source quality and reasoning transparency |
TikTok also uses different metric definitions across analytics surfaces. Its Shop Analytics documentation notes that revenue can be divided by livestream, video, and product-card content, while Affiliate Center provides separate creator, product, video, and LIVE breakdowns. GMV attribution can vary by report and may include canceled or refunded orders. Before comparing periods, sellers should confirm that the metric name, attribution window, market, currency, and date range have not changed.
The safest rule is simple: use first-party data for the seller's own performance, public evidence to confirm competitor activity, and estimates to decide what deserves deeper investigation. Never present estimated competitor GMV as audited revenue.
8 Competitor Signals That Matter
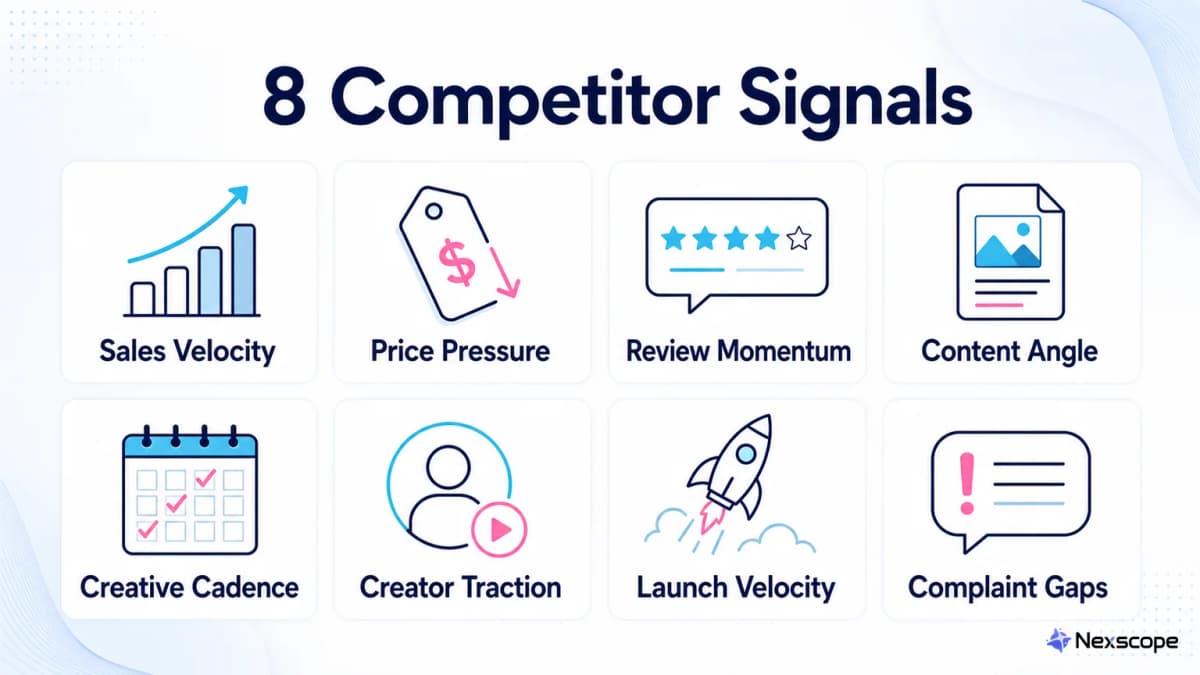
| Signal | What it measures | Strongest available evidence | Decision supported |
|---|---|---|---|
| Sales velocity | Direction and pace of demand | First-party data or repeated estimates | Validate market momentum |
| Price pressure | Promotion and positioning changes | Public price history | Set a viable price band |
| Review momentum | Buyer adoption and satisfaction | Public review count and rating mix | Judge traction and product risk |
| Content angle | Problems and benefits used to sell | Listings, videos, livestreams | Refine positioning and proof |
| Creative cadence | Frequency of content testing | Video and livestream activity | Plan production capacity |
| Creator traction | Breadth and concentration of affiliate support | Creator posts and affiliate analytics | Evaluate distribution risk |
| Launch velocity | Speed of catalog expansion | Product additions and launch dates | Detect category commitment |
| Complaint gaps | Repeated unmet customer needs | Low-star reviews and return themes | Improve product and listing |
1. Sales Velocity
Sales velocity describes how quickly demand appears to be rising, holding, or falling during a defined period. It is more useful than a lifetime sales total because a high cumulative number can hide a product that has already peaked.
For a seller's own products, TikTok Shop provides GMV, orders, units sold, customers, and time-based comparisons across several analytics views. For competitors, the equivalent values are commonly estimated. Record the tool, market, date range, and capture date every time an estimate is used.
Look for persistent movement across multiple windows. A seven-day increase that continues into a 30-day view is more meaningful than a one-day spike. Confidence rises when sales estimates move with public review growth, creator activity, and new content.
Decision: treat accelerating sales velocity as a demand signal only after checking price changes and traffic drivers. A large discount or one high-reach creator can produce a temporary jump without proving stable category demand.
2. Price Pressure
Price pressure measures how competitors use list prices, discounts, coupons, bundles, shipping offers, and creator incentives to influence conversion. The current selling price matters, but the pattern of changes explains more about the competitor's strategy.
Capture regular price, sale price, discount depth, bundle size, shipping threshold, and visible promotion dates. Compare equivalent pack sizes and specifications. A $19 product and a $29 two-pack are not direct price equivalents.
Frequent discounting can indicate aggressive acquisition, excess inventory, seasonal promotion, or weak full-price conversion. Stable prices combined with continuing reviews and creator activity may indicate stronger pricing power.
Decision: identify a sustainable price band before sourcing or launching. Copying the lowest visible price can destroy margin without reproducing the competitor's creator relationships, repeat demand, or cost structure.
3. Review Momentum
Review momentum combines review count growth, rating distribution, recency, and repeated themes to estimate buyer adoption and product satisfaction. Review velocity is often more informative than the displayed average rating alone.
TikTok Shop's Review Performance feature lets sellers compare their own rating distribution with the top 20% of merchants in a selected category. Competitor product pages provide public review counts and comments that can be captured over time.
Track new reviews per week, the share of recent low-star reviews, and whether complaints are increasing after a sales spike. A high rating based on a small or old review set carries less evidence than a stable rating with continuous recent reviews.
Decision: use review momentum to test whether estimated sales growth appears to be reaching real buyers. Read the comments before concluding that growth signals a good product opportunity.
4. Content Angle
Content angle is the specific problem, benefit, audience, demonstration, or proof used to persuade a viewer to consider a product. Two sellers can offer similar items while competing through completely different messages.
Classify competitor videos and listings by hook, target user, promised outcome, demonstration type, objection handled, and call to action. Examples include time savings, before-and-after proof, portability, giftability, ingredient transparency, or problem prevention.
The strongest angle is not always the most frequently posted one. Compare which themes appear repeatedly among top-performing videos and which customer questions remain unanswered. TikTok Shop seller tools can accelerate research, but the final judgment still requires checking the original product and content evidence.
Decision: use content-angle gaps to create a clearer claim or stronger demonstration, not to reproduce a competitor's script, visual identity, or copyrighted creative.
5. Creative Cadence
Creative cadence measures how often a shop, brand, or creator publishes new product videos, livestreams, hooks, formats, and variations. It indicates testing capacity and can explain why one product keeps receiving distribution.
Record weekly video count, livestream frequency, number of distinct hooks, reuse of winning formats, and the time between product launch and the first wave of content. TikTok's video analytics documentation recommends studying top-performing videos for the same product and comparing viewer and purchaser behavior for a seller's own content.
A high posting rate with declining engagement may indicate creative fatigue. TikTok Shop's video analytics guidance recommends comparing product, content, and audience performance rather than relying on a view count alone. A moderate posting rate with several distinct creators and repeated proof formats can be healthier than many near-identical videos from one account.
Decision: estimate the content resources required to compete before launching. Product economics may look attractive while the required creative output is operationally unrealistic.
6. Creator Traction
Creator traction measures how broadly and effectively a product is distributed through affiliate creators, videos, and livestreams. The number of active creators matters, but concentration and continued participation matter more.
TikTok Shop Affiliate Center analytics can break a seller's own affiliate performance down by creators, products, videos, and livestreams using GMV, orders, items sold, and traffic. Competitor research usually relies on observable creator posts and estimated attribution.
Track the number of active creators, posting frequency, creator size mix, repeated partnerships, and the share of visible activity concentrated among the top accounts. A product supported by one creator has a different risk profile from a product repeatedly promoted across many relevant creators.
Decision: determine whether demand appears product-led or distribution-led. If activity collapses when one creator stops posting, the opportunity may depend on access to similar talent and economics.
7. Launch Velocity
Launch velocity measures how quickly a competitor adds products, variants, bundles, and category extensions. It reveals where the shop is investing attention and whether a niche is expanding or being tested cautiously.
Record new product dates, variant additions, bundle changes, and whether older items are removed or discounted. Compare launch activity with creator recruitment and content cadence. A new catalog item with no supporting content may be a small test, while coordinated product, creator, and video activity suggests a stronger commitment.
Fast catalog expansion can also create operational strain. Review changes, stock availability, shipping complaints, and listing quality can show whether the competitor is scaling faster than it can maintain service.
Decision: use launch velocity to spot emerging subcategories and positioning shifts. Do not assume every new SKU represents validated demand.
8. Complaint Gaps
Complaint gaps are recurring customer problems that competitors have not resolved through product design, packaging, instructions, service, or listing clarity. They often provide the most actionable path to differentiation.
Group recent low-star reviews by failure type, frequency, severity, and whether the issue can be fixed. Common categories include durability, sizing, missing parts, misleading demonstrations, difficult setup, packaging damage, scent, texture, compatibility, and slow support.
Separate product problems from expectation problems. A listing may attract the wrong buyer because it omits dimensions, materials, limitations, or setup requirements. In that case, clearer content can reduce dissatisfaction without changing the product.
Decision: prioritize gaps that are repeated, important to purchase decisions, and realistically solvable. One unusual complaint should not drive a new specification.
Multi-Signal Decision Patterns
Individual metrics describe activity. Combinations explain what may be causing it.
| Pattern | Likely interpretation | Recommended response |
|---|---|---|
| Sales up + reviews up + creators broadening | Demand is reaching multiple buyer sources | Validate margin, supply, and differentiation |
| Sales up + deep discount + one dominant creator | Promotion or creator-dependent spike | Wait for post-promotion persistence |
| Reviews up + complaints repeating | Real demand with an unresolved product gap | Test a product or listing improvement |
| Content volume up + engagement down | Creative fatigue or weak new hooks | Study proof formats before increasing output |
| New products up + creator activity up | Coordinated category expansion | Monitor launches and adjacent niches |
| Price stable + reviews steady + repeat creators | Potentially durable positioning | Study why buyers accept the price |
| Estimated GMV up + no public evidence changes | Low-confidence anomaly | Recheck the estimate and source coverage |
A practical decision should cite at least three supporting observations and one plausible alternative explanation. This rule prevents a single metric from becoming a confident but fragile conclusion.
For example, estimated GMV growth, faster review accumulation, and a broader creator base may support the conclusion that demand is strengthening. The alternative explanation could be a temporary promotion. Price history and post-promotion persistence can then confirm or weaken the conclusion.
Weekly Competitor Workflow
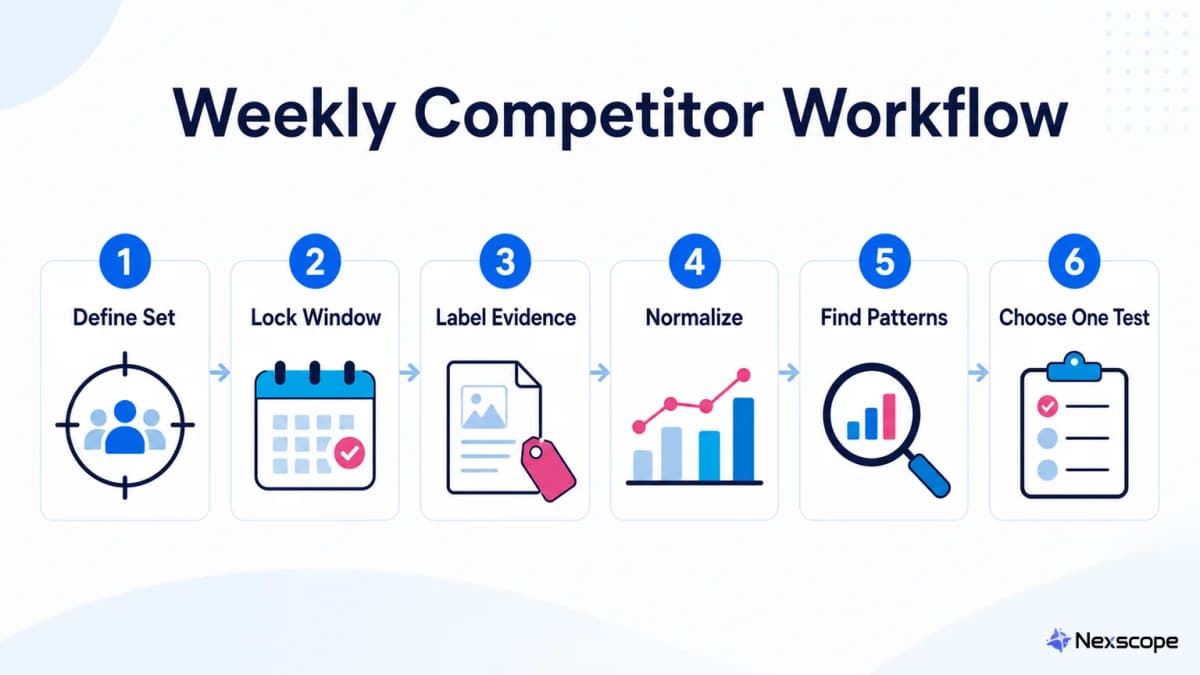
Step 1: Define the Set
Choose three direct competitors and two adjacent competitors. Direct competitors serve the same buyer with a similar product and price range. Adjacent competitors solve the same problem through a different product, format, or positioning angle.
Step 2: Lock the Window
Use consistent seven-day and 30-day windows. Record the market, currency, timezone, product URL, capture date, and tool used. A rolling window should not be compared with a calendar month without adjustment.
Step 3: Label the Evidence
Mark every field as first-party, publicly observed, platform benchmark, estimated, or analyst interpretation. Leave a value blank when it cannot be supported. A blank field is safer than invented precision.
Step 4: Normalize Comparisons
Compare equivalent variants, pack sizes, markets, and time periods. Convert prices to a common unit when necessary. Separate organic-looking content, affiliate activity, and paid promotion when the source permits that distinction.
Step 5: Find Patterns
Look for agreement or conflict among sales, price, reviews, content, creators, launches, and complaints. Write a one-sentence explanation of what changed, what evidence supports it, and what else could explain it.
Step 6: Choose One Test
Turn the strongest pattern into a limited action. Examples include testing a different hook, clarifying one listing claim, comparing a new bundle, contacting a broader creator segment, or investigating a repeated product complaint. Define the success metric and review date before the test starts.
The scorecard below keeps weekly research consistent:
| Competitor | Signal | Current observation | Prior observation | Change | Source class | Confidence | Decision impact |
|---|---|---|---|---|---|---|---|
| Competitor A | Review momentum | Public | High | ||||
| Competitor A | Price pressure | Public | High | ||||
| Competitor A | Sales velocity | Estimated | Medium | ||||
| Competitor A | Creator traction | Public/estimated | Medium | ||||
| Competitor A | Complaint gaps | Public | High |
Turning Signals Into Decisions
Tracking eight separate signals becomes difficult when the evidence sits across product pages, reviews, analytics exports, creator activity, and research notes. The useful output is a concise decision brief that preserves the source and confidence behind every recommendation.
Nexscope provides structured ecommerce data and focused seller workflows. Teams can use Nexscope's web tools directly or connect governed capabilities to their existing Agent through API, MCP, or Skills. Ready workflows include Keyword to Ads, Video Clone, and Buy Box Repricer.
- Define the product, category, market, and competitors.
- Collect the available product, price, review, creator, content, and market signals.
- Label observations by source type and confidence.
- Compare signal changes across consistent periods.
- Identify opportunity, risk, and alternative explanations.
- Produce a short action plan with the next test and review date.
The output is only as reliable as the evidence provided. Competitor sales and GMV estimates should remain labeled as estimates, and conclusions should state when a required field is missing.
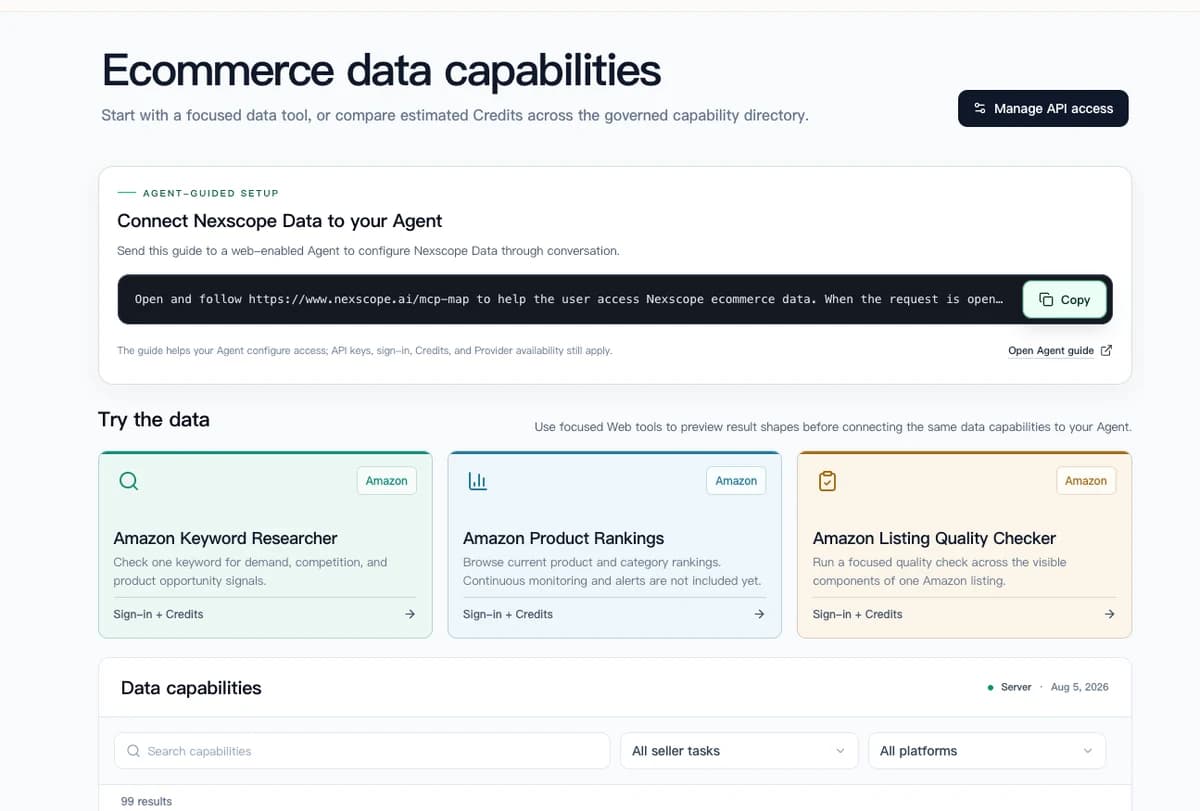
This approach gives teams a repeatable research record instead of a collection of disconnected screenshots. It can also connect competitive findings with listing optimization, sourcing questions, pricing decisions, and future content tests.
Turn Competitor Signals Into Action
Use Nexscope to organize TikTok Shop competitor research, compare evidence, and plan the next test.
Get Started Free →Common Analytics Mistakes
- Treating estimated GMV as exact revenue: Competitor figures are often modeled from incomplete signals. Keep the source, capture date, and confidence label attached.
- Comparing different definitions: GMV, affiliate GMV, direct GMV, paid orders, and items sold can use different attribution logic. Confirm the definition before comparing values.
- Reacting to one viral period: A one-day or seven-day spike may disappear after a creator post or discount ends. Check a longer window and supporting signals.
- Ignoring variant and market differences: Pack size, product specifications, currency, fulfillment, and regional availability can invalidate a simple comparison.
- Counting creators without concentration: Ten visible creators do not prove broad distribution if one account appears to drive most of the activity.
- Copying competitor creative: Research should identify buyer questions, proof formats, and message gaps. It should not reproduce scripts, visuals, or protected brand elements.
- Collecting without deciding: Every weekly review should end with one documented decision, test, owner, metric, and review date.
Conclusion
TikTok Shop analytics becomes actionable when sellers separate first-party data from public observations and third-party estimates, then interpret multiple signals together. Sales velocity shows direction. Pricing explains pressure. Reviews reveal adoption and dissatisfaction. Content, creators, and launch activity show how demand is being developed. Complaint gaps identify where a better product or clearer listing may win.
The eight-signal structure provides a repeatable way to move from observation to action without claiming access to a competitor's private performance data. A weekly process with consistent dates, source labels, confidence levels, and alternative explanations produces stronger decisions than a dashboard screenshot or trending-product list.
Connect Ecommerce Data to Your Agent
Use Nexscope through API, MCP, or Skills, or open a ready seller workflow.
Explore Ecommerce Data →1,000 free credits • API, MCP & Skills
Frequently Asked Questions
What is TikTok Shop analytics?
TikTok Shop analytics is the process of collecting and interpreting sales, traffic, product, content, creator, and customer data generated through TikTok's commerce experience. Seller Center provides first-party information for a seller's own account, including GMV, orders, product performance, traffic sources, videos, livestreams, and affiliate activity. Competitor analysis adds public observations and third-party estimates, which should be labeled separately.
Which TikTok Shop metrics matter most?
The most useful metrics depend on the decision. For a seller's own shop, GMV, orders, units sold, conversion, traffic sources, refund behavior, video performance, and affiliate contribution explain operational performance. For competitor research, sales velocity, price changes, review momentum, content angle, creative cadence, creator traction, launch velocity, and complaint themes provide a more complete view than any single number.
Can sellers see competitor sales?
Sellers generally cannot access another shop's private Seller Center data. Competitor sales and GMV figures shown by market-intelligence platforms are usually estimates derived from observable or licensed signals and proprietary models. They can help identify direction and prioritize research, but they should not be presented as audited revenue. Public price, review, product, video, and creator evidence can be used to confirm or challenge the estimate.
How accurate are GMV estimates?
Accuracy varies by provider, market coverage, product, date range, attribution method, and the amount of observable activity. A useful estimate should include a methodology or confidence range, but many interfaces display a single number. Sellers should compare the same provider over consistent periods and look for supporting movement in reviews, prices, creators, and content instead of treating the estimate as an exact financial statement.
How often should competitors be reviewed?
A weekly review is frequent enough for most active categories, with a monthly deep dive for broader changes. Fast-moving launches, major promotions, or seasonal campaigns may justify daily monitoring for a limited period. The schedule matters less than consistency: use the same market, time window, product variant, metric definition, and source so that changes reflect the competitor rather than a different measurement method.
What indicates durable product demand?
Durable demand usually appears across several independent signals. Examples include continuing sales velocity after a promotion ends, steady recent review growth, multiple active creators, repeated content production, stable pricing, and manageable complaint patterns. None of these proves future performance. Together, they provide stronger evidence than a viral video, a high lifetime sales estimate, or a short appearance on a trending-products list.
Can AI analyze TikTok Shop competitors?
AI can organize large amounts of product, review, pricing, creator, and content evidence, compare periods, identify repeated themes, and produce a structured decision brief. The quality of the result still depends on the inputs. An AI system should preserve source labels, separate observed data from estimates, acknowledge missing evidence, and explain why each recommendation follows from the available signals.
What is the biggest analytics mistake?
The biggest mistake is making a decision from one impressive metric without checking what caused it. Estimated GMV may rise because of a discount, one creator, or a short campaign. A high rating may rely on old reviews. A large creator count may hide concentration in one account. Competitor decisions should combine at least three supporting signals and record an alternative explanation before action is taken.
Sources
- TikTok Shop. (2026). Shop Tab & Search Analytics. Retrieved from seller-us.tiktok.com
- TikTok Shop. (2025). How to Use Product Analytics. Retrieved from seller-us.tiktok.com
- TikTok Shop. (2025). Video Analytics. Retrieved from seller-us.tiktok.com
- TikTok Shop. (2025). How to Use Affiliate Center Analytics. Retrieved from seller-us.tiktok.com
- TikTok Shop. (2025). How to Access Review Performance. Retrieved from seller-us.tiktok.com