

Amazon Market Research Report 2026

Table of Contents
Product Pricing, Brand Competition & Fulfillment Insights
October 12, 2026 snapshot · 200 unique ASINs · 50 listings per category
This Amazon market research report compares 200 listings across Home & Kitchen, Beauty & Personal Care, Pet Supplies, and Sports & Outdoors. Median returned prices fall between $14.48 and $17.99, but the products behind those numbers differ substantially. Skin care accounts for 38 of 50 beauty listings. Cats and dogs account for 49 of 50 pet listings. Sports & Outdoors includes 45 identified brands across its 50 records.
This report is based on Amazon product listing data retrieved via the Nexscope API on October 12, 2026, with identical search settings across all four categories and results sorted by monthly sales. The report offers insights into product pricing, brand competition, and fulfillment to help sellers identify opportunities for further product research.
Build Your Own Amazon Product Dataset
Use the Amazon Product Database Search API to find listings by category, price, and sales filters, then build a comparison set for your own market research.
Try the Amazon Product Data API →Key Findings from Four Amazon Categories
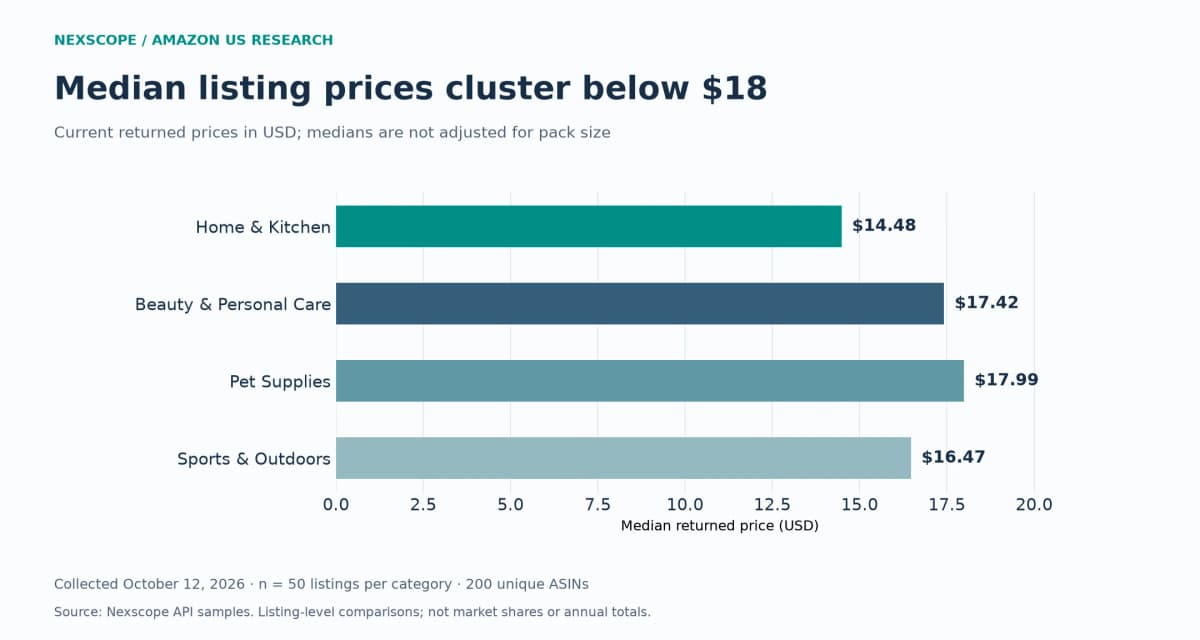
Similar median prices coexist with very different brand and fulfillment profiles. Home & Kitchen has the lowest median returned price, Beauty & Personal Care has the largest proportion of listings below $20, and Pet Supplies has the highest count of AMZ fulfillment labels.
| Metric | Home & Kitchen | Beauty & Personal Care | Pet Supplies | Sports & Outdoors |
|---|---|---|---|---|
| Sampled listings | 50 | 50 | 50 | 50 |
| Median returned price | $14.48 | $17.42 | $17.99 | $16.47 |
| Listings below $20 | 33 (66%) | 37 (74%) | 30 (60%) | 33 (66%) |
| Identified brands | 38 | 25 | 32 | 45 |
| Missing brand records | 1 | 0 | 1 | 0 |
| Median returned rating | 4.6 | 4.6 | 4.7 | 4.6 |
| Listings with review-count field ≥10,000 | 40 | 38 | 45 | 28 |
Each category contributes exactly 50 records by design. That equal allocation makes the samples easier to compare; it says nothing about the relative size of the four categories. Counts and percentages throughout this report are listing-level observations, without sales or revenue weighting.
Source: Nexscope API samples, October 12, 2026. Each category contains 50 listings.
Pricing Analysis: Most Sampled Listings Cost Less Than $20
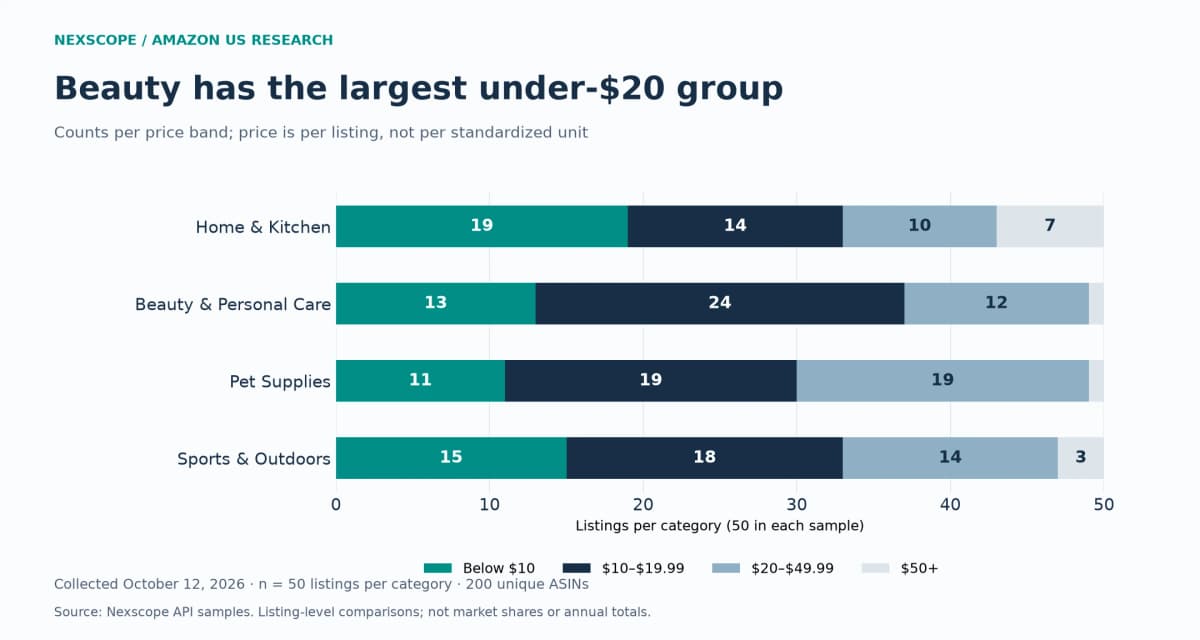
Most listings in every category have returned prices below $20. The largest difference is in the higher price bands: Home & Kitchen has seven listings at $50 or more, compared with one each in Beauty & Personal Care and Pet Supplies.
| Returned price | Home & Kitchen | Beauty & Personal Care | Pet Supplies | Sports & Outdoors |
|---|---|---|---|---|
| Below $10 | 19 | 13 | 11 | 15 |
| $10–$19.99 | 14 | 24 | 19 | 18 |
| $20–$49.99 | 10 | 12 | 19 | 14 |
| $50 or more | 7 | 1 | 1 | 3 |
A similar median does not mean similar product economics. A pack of pet food, a skin-care product, a kitchen accessory, and an exercise item have different quantities, shipping characteristics, usage patterns, and competing alternatives. The returned price is the price of a listing, not a standardized cost per ounce, item, or use.
A useful next comparison should therefore match product purpose and pack size. Within a defined product group, researchers can examine the range of prices alongside materials, dimensions, quantities, and product features. Comparing only the four category medians would miss those differences.
The Amazon product search used here supports narrower category and price filters. Applying those filters produces a more focused research population; it also changes the scope, so each follow-up dataset should retain its own selection criteria and collection date.
Source: Nexscope API samples, October 12, 2026. Each category contains 50 listings.
Product Mix and Research Opportunities by Category
The strongest signals concern product mix rather than category-wide growth. Each sample highlights a different starting point for a more detailed investigation.
Home & Kitchen
Kitchen & Dining supplies 18 of the 50 records, followed by Bath with seven. Bedding and Home Décor Products each contribute five. The rest span cleaning appliances, storage, air quality, party supplies, ironing, and seasonal décor.
This is a broad mix of everyday accessories and higher-priced equipment. Its $14.48 median is the lowest of the four samples, but seven listings cost at least $50. A seller researching kitchen tools should separate those tools from appliances and household textiles before using the sample as a price benchmark.
The presence of multiple everyday product types suggests several possible research paths. It does not establish that all of those niches have attractive margins or room for another similar listing.
Beauty & Personal Care
Skin Care accounts for 38 records, or 76% of the beauty sample. Makeup contributes six, Tools & Accessories three, Hair Care two, and Personal Care one.
The sample is therefore much closer to a skin-care-heavy view than an even survey of the beauty category. Its 25 identified brands include eight medicube listings, five CeraVe listings, four The Ordinary listings, and four ANUA listings. These counts make individual brand presence more visible here than in the sports sample.
A follow-up study should separate product formats and intended uses before comparing price or demand. A cleanser, serum, and cosmetic tool are not interchangeable alternatives simply because they share a category. This snapshot does not identify an ingredient trend or prove that a brand is growing.
Pet Supplies
Cats account for 27 records, dogs for 22, and horses for one. Together, the cat and dog branches make up 98% of the sample.
Pet Supplies also has the highest median returned price, $17.99, and 19 records in the $20–$49.99 band. Friskies appears six times, while Fresh Step and Fancy Feast each appear four times. These are counts of brand labels in the selected listings, not shares of pet spending.
The next useful division is by product type and quantity: food, treats, litter, accessories, and other supplies should have separate comparison sets. Pack-size normalization is especially important before interpreting a higher listing price as a premium positioning strategy.
Sports & Outdoors
Outdoor Recreation contributes 18 records and Exercise & Fitness 15. Sports contributes six, Sports & Outdoor Recreation Accessories five, Hunting & Fishing four, and Fan Shop two.
Brand representation is spread widely: 45 identified brands appear across 50 records. Five brands appear twice each, while the remaining 40 appear once. The sample's median returned price is $16.47, with 33 listings below $20.
That variety supports research by activity or specific use case. It does not show that competition is weak. A broad category can contain many brands while individual niches remain highly competitive. Seasonal demand also requires observations from more than one collection date.
Brand Representation: Top-Five Concentration by Category
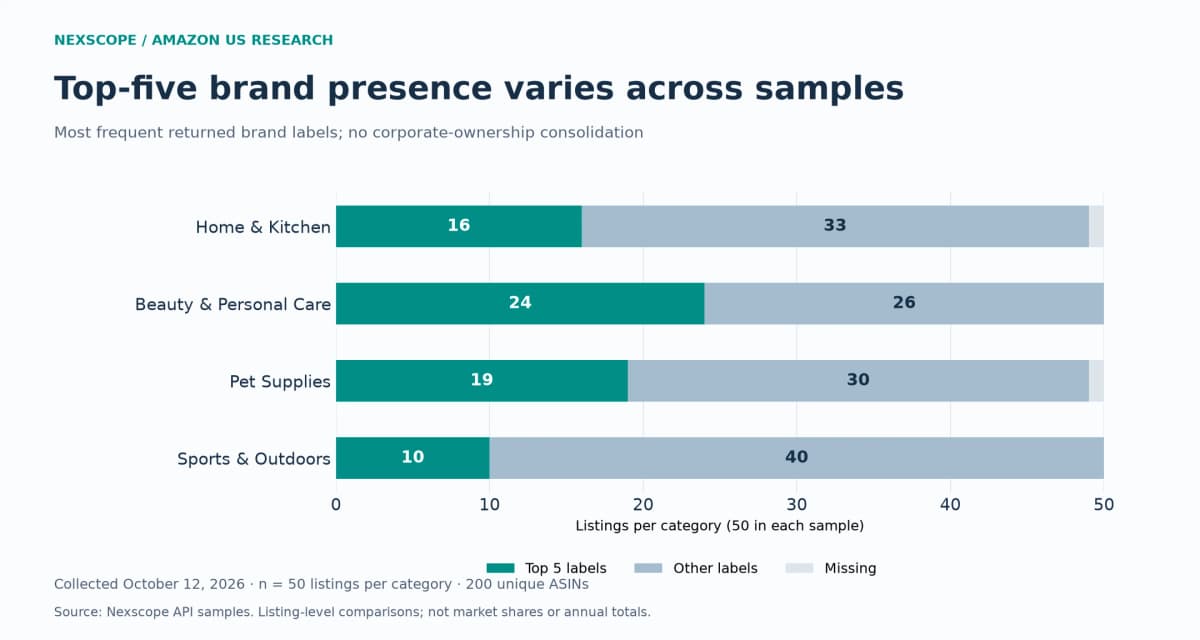
The five most frequently represented brand labels account for 48% of the beauty sample and 20% of the sports sample. Pet Supplies falls between them at 38%, and Home & Kitchen at 32%.
| Category | Five most represented brand labels | Listings represented | Share of sample |
|---|---|---|---|
| Home & Kitchen | BLACK+DECKER, Amazon Basics, Levoit, Utopia Bedding, Cosori | 16 | 32% |
| Beauty & Personal Care | medicube, CeraVe, The Ordinary, ANUA, La Roche-Posay | 24 | 48% |
| Pet Supplies | Friskies, Fresh Step, Fancy Feast, Greenies, Amazon Basics* | 19 | 38% |
| Sports & Outdoors | HotHands, WILSON, Owala, Fit & Fresh, Amazon Basics | 10 | 20% |
The pet sample may have tied brand counts at the cutoff; the displayed fifth label follows response order among ties. The top-five count is unchanged by selecting another equally frequent label.
These figures measure representation by returned brand name. They do not consolidate corporate ownership or weight products by sales. Two labels may belong to the same parent company, and two listings may have very different commercial importance.
For a new product concept, the more relevant question is how many of these brands compete in its exact product group. Broad brand variety can help identify research directions, but it cannot establish how difficult it will be to win customers in a specific niche.
Source: Nexscope API samples, October 12, 2026. Each category contains 50 listings.
Fulfillment Mix, Ratings, and Review Counts
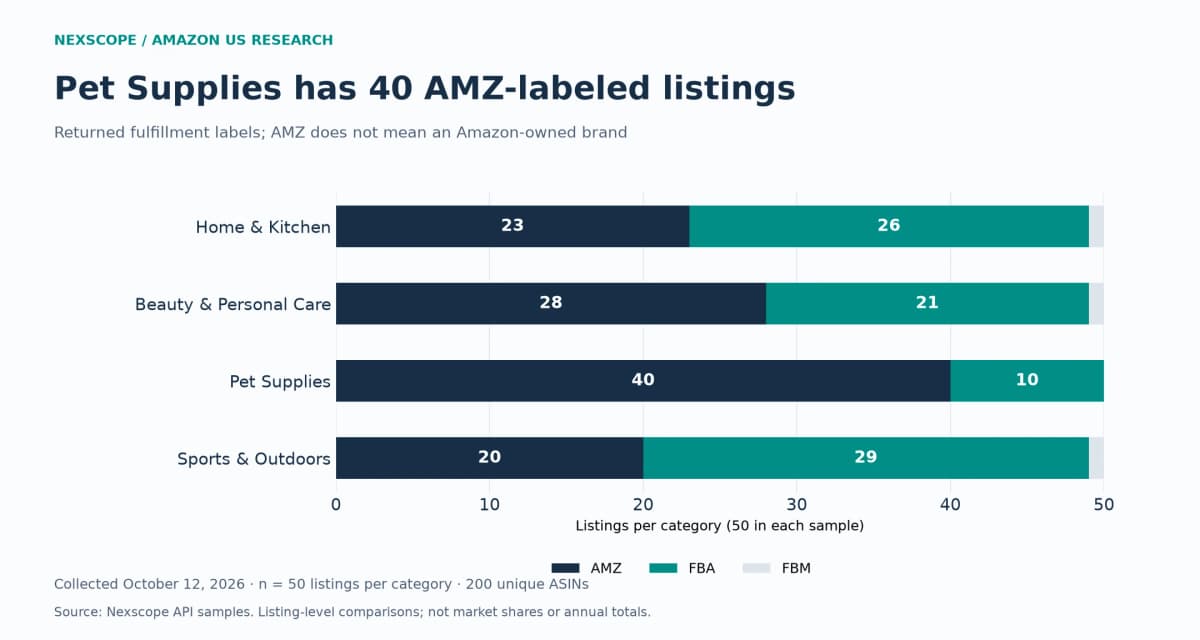
FBA and AMZ labels account for almost all records in every sample. Pet Supplies has the highest AMZ count, at 40 of 50, while Sports & Outdoors has the highest FBA count, at 29.
| Returned fulfillment label | Home & Kitchen | Beauty & Personal Care | Pet Supplies | Sports & Outdoors |
|---|---|---|---|---|
| FBA | 26 | 21 | 10 | 29 |
| AMZ | 23 | 28 | 40 | 20 |
| FBM | 1 | 1 | 0 | 1 |
These labels are preserved as returned by the source. AMZ is not a brand-ownership label, and its count must not be presented as Amazon private-label share. Similarly, the predominance of a fulfillment label does not prove that choosing it will cause a product to sell well.
Customer-feedback histories are substantial in many records. Pet Supplies has 45 listings with a returned review-count field of at least 10,000, compared with 28 in Sports & Outdoors. Median ratings range from 4.6 to 4.7. Counts may reflect shared variation-level feedback and should not be interpreted as verified written reviews for a single variant.
A practical follow-up is to investigate recurring complaints within a narrowly defined competitor set. Product review data can support that analysis after checking review dates and variant relevance. This report did not analyze review text and makes no claims about customer sentiment.
Source: Nexscope API samples, October 12, 2026. Each category contains 50 listings.
Conclusion
The four samples suggest different research priorities. Home & Kitchen benefits from separating accessories from appliances. Beauty & Personal Care needs a closer look at its skin-care-heavy product mix. Pet Supplies requires careful product-type and pack-size comparisons. Sports & Outdoors is better divided by activity and use case than treated as one competitive market.
The next decision should be a narrower research question: which specific products solve the same customer problem, how their offers differ, and whether those differences leave a viable product opportunity.
Explore More Amazon Data with Nexscope
This report used the Amazon Product Database Search API to query 200 listings across four categories and compare pricing, brand representation, and fulfillment. Nexscope also offers a broader range of Amazon data APIs for extending your research, including product details and customer reviews.
Build Your Next Amazon Research Report
Explore Nexscope’s Amazon data APIs to find the data you need for your own product and market analysis.
Explore Amazon Data APIs →Frequently Asked Questions
Does this report cover all Amazon categories?
No. It covers Home & Kitchen, Beauty & Personal Care, Pet Supplies, and Sports & Outdoors. Each contributes 50 listings. The report does not include every Amazon category or estimate how large the selected categories are relative to each other.
Is this a full-year 2026 sales report?
No. The year identifies the edition. The data was collected on October 12, 2026, and describes a same-day snapshot. Annual sales, quarterly growth, and year-over-year comparisons would require verified historical coverage and consistent measurement periods.
Which sample has the lowest median price?
Home & Kitchen has the lowest median returned price at $14.48. Sports & Outdoors follows at $16.47, then Beauty & Personal Care at $17.42 and Pet Supplies at $17.99. These are listing prices across different product mixes, not standardized unit-price benchmarks.
Does greater brand variety mean easier competition?
No. Sports & Outdoors has 45 identified brands across 50 records, but those products span several activities and subcategories. Competition must be assessed within a set of close substitute products, alongside demand, pricing, customer feedback, and costs.
Can sellers use this report to choose a product to launch?
The findings can guide a research shortlist. They cannot establish that a product will be profitable. A launch decision needs a narrower competitor analysis, reliable demand history, product costs, and a concrete reason for customers to choose the proposed offer.
Sources
- Nexscope. 2026. Amazon US Four-Category Research Dataset, collected October 12, 2026. Original analysis of 200 product records across four category queries. nexscope.ai.
- Nexscope. 2026. Amazon Product Database Search API. nexscope.ai.
- Nexscope. 2026. Amazon Product Detail API and Amazon Reviews List API. nexscope.ai.