

1688 Best-Selling Products: 15 Sourcing Insights for 2026

Table of Contents
What October’s product, price, and supplier data suggests for your next sourcing cycle.
The October report on 1688 best-selling products uses a monthly ranking from Nexscope’s 1688 Bestselling Products API. It points to an assortment dominated by familiar household goods and low listed prices. A closer look reveals something more useful for sellers: many leading listings represent similar product needs, reported unit volume is highly concentrated, and several attractive offers lead back to the same supplier.
Those patterns suggest five priorities for your next sourcing cycle:
- Differentiate the offer: repeated paper-product listings leave pack size and customer use case worth investigating.
- Read volume carefully: one sock listing contributes 60.9% of reported units across the downloadable top 30.
- Evaluate the delivered offer: 66% of the full report’s listings are priced below ¥5, making fulfillment economics a central question.
- Count supply alternatives: the top 30 contains 22 supplier names, with repeated offers from the same shops.
- Use small orders to learn: 95 of 100 listings show a one-unit minimum, creating leads for sample-based comparisons.
1. Paper Goods Dominate the Assortment
Personal Care & Household makes up 41% of the full report, rising to 63.3% of the downloadable top 30. Within those 30 entries, 17 are tissue or toilet-paper listings: 56.7% of the entire group.
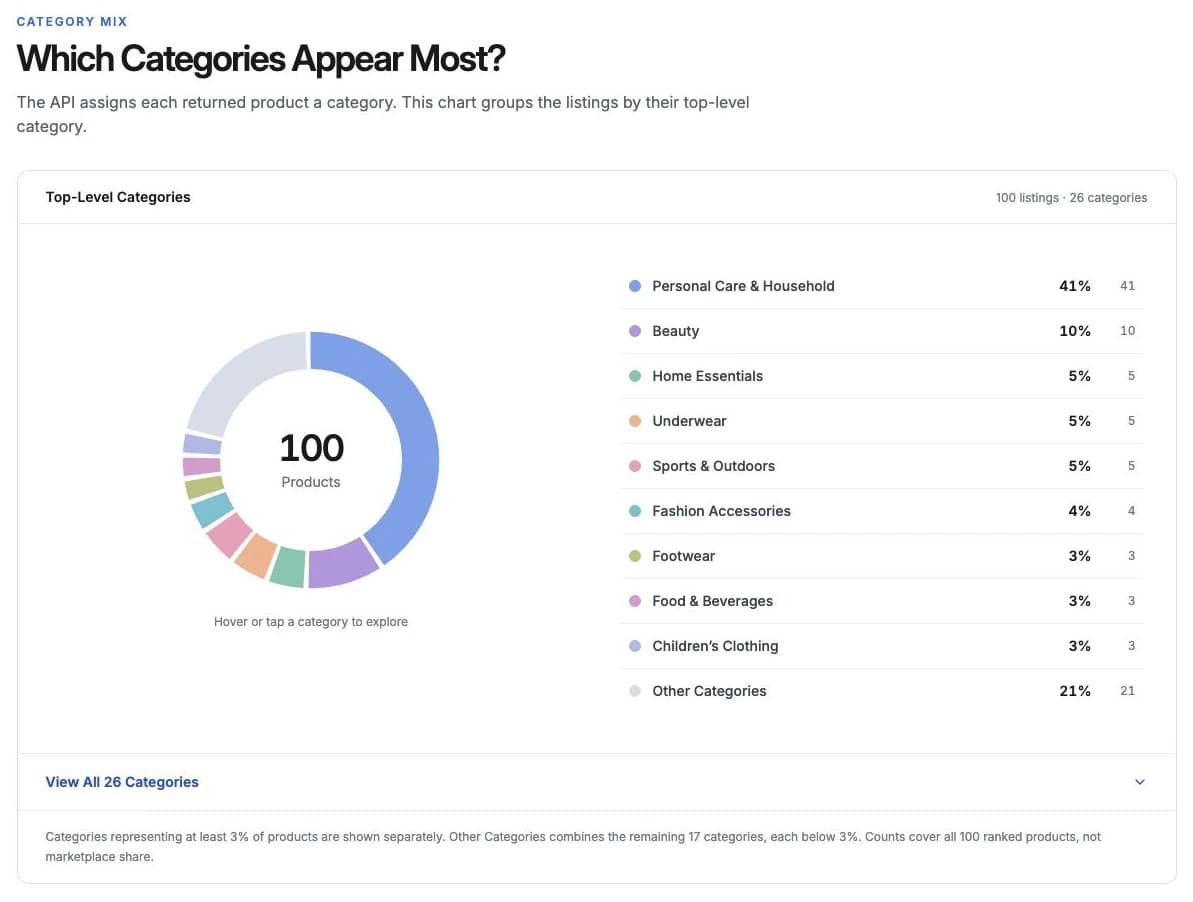
Category counts across the report’s 100 listings. Source: Nexscope October 2026 report.
The Insight
- The leading assortment is less diverse than its listing count suggests. Seventeen paper-product offers represent a narrower set of customer needs than 17 distinct product concepts.
- Routine-use products deserve attention alongside novelty products. The ranking is rich in familiar consumables, making everyday needs a useful starting point for research. Purchase frequency still needs to be tested in your own market.
- Differentiation may sit in the specification. Sheet size, ply, pack quantity, and packaging create concrete comparison points when the underlying product is familiar.
What Sellers Can Do
- Choose one customer use case, such as compact travel packs or household refills, before comparing suppliers.
- Read competing retail reviews for recurring complaints about pack size, durability, or packaging. Turn those complaints into a sample checklist.
- For bulky paper products, compare the full carton’s delivered cost with the local wholesale alternative. A low factory-side price needs enough room to absorb shipping.
Decision: Shortlist a defined paper-product offer with a clear specification, rather than several nearly identical tissue listings.
2. Unit Volume Is Driven by One Outlier
The disposable travel sock listing ranks tenth by reported orders, but contributes 3,200,246 of the 5,252,463 reported units across the downloadable top 30. That is 60.9% of reported units, versus just 4.1% of reported orders in the same group.
| Product | Reported orders | Reported units | Units ÷ orders |
|---|---|---|---|
| Manhua facial tissues | 95,937 | 97,221 | 1.01 |
| Aiyuantang weighted sleep mask | 95,423 | 108,718 | 1.14 |
| Disposable travel socks | 80,497 | 3,200,246 | 39.76 |
Calculated from the report’s CSV. Ratios use reported fields; check each listing’s unit and pack definition before comparing physical quantities.
The Insight
- The ranking changes meaning with the metric. Tissues lead by orders, while socks dominate the unit total within these 30 entries.
- A group total can conceal an extreme purchasing pattern. Aggregating units would give this one listing disproportionate influence over the apparent size of the assortment.
- The sock listing raises a pack-size question. Its ratio makes bulk quantities and multipacks worth investigating, but does not establish what a retail customer buys at once.
What Sellers Can Do
- Record orders and units separately in your shortlist. Use the first to compare reported transactions and the second to investigate purchasing quantities.
- Confirm whether the supplier unit means a piece, pair, pack, or another configuration.
- For socks, compare a small travel pack with a larger replenishment pack using retail prices, shipping costs, and customer use cases. Test the format that best fits your channel.
Decision: Use the volume outlier to investigate packaging and order structure before deciding how to merchandise the product.
3. Low Prices Favor Careful Pack Economics
Across the report’s 100 listings, 66% have listed prices below ¥5, 88% below ¥10, and the median is ¥2.90. The ¥2–¥4.99 band is the largest, containing 35 listings.
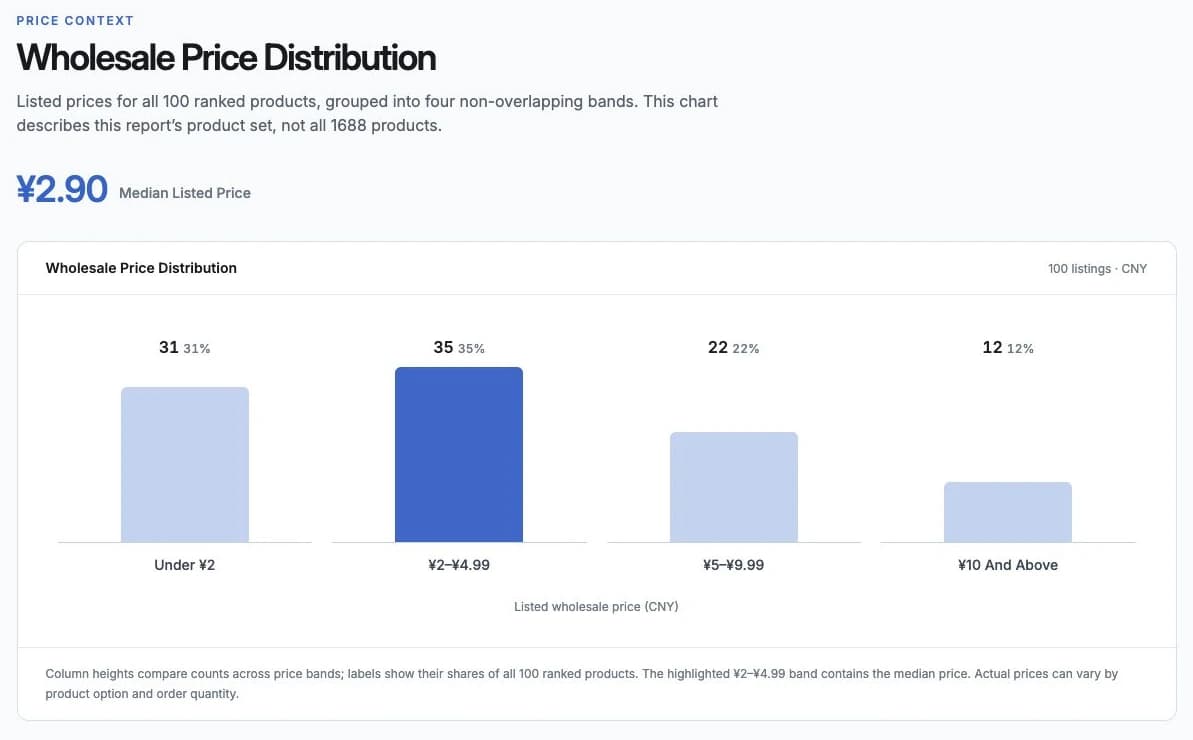
Listed wholesale prices in CNY, across 100 products. Source: Nexscope October 2026 report.
The Insight
- The assortment is concentrated at low listed price points. This makes fixed costs per shipment a priority: packaging, handling, and delivery can consume the room left by a small retail order.
- Supplier starting prices can hide materially different offers. The first-ranked tissue listing shows ¥2.10, while its expanded details contain eight SKU options spanning ¥2.10–¥61.90.
- Pack configuration can change the commercial case. Multipacks may spread fulfillment costs over more items, but they also change shipment size, customer spend, and purchase appeal.
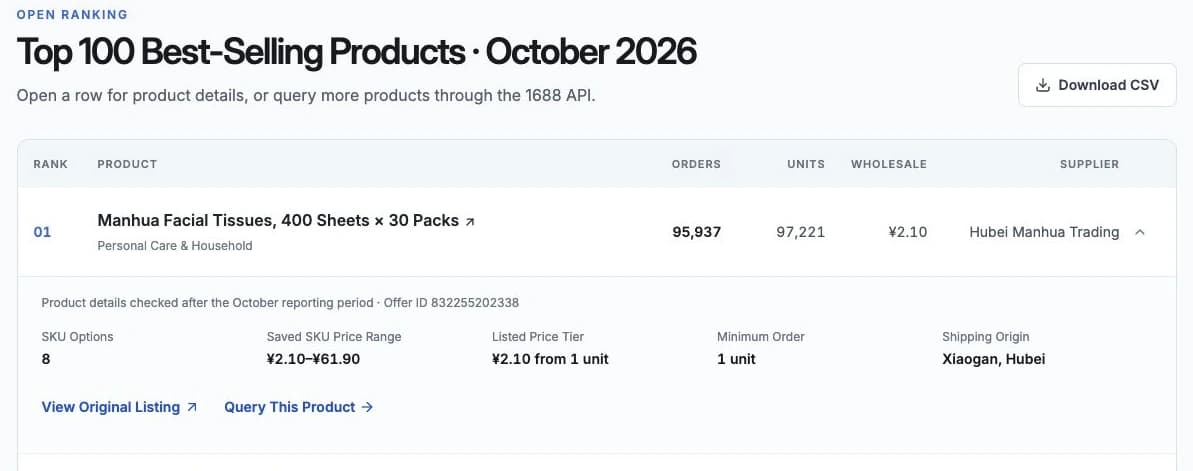
The leading tissue offer and its later product-detail snapshot. Match the quoted price to the selected SKU.
What Sellers Can Do
- Compare cost per retail pack, using identical specifications and quantities across supplier quotes.
- Model single-unit and multipack offers separately: expected selling revenue minus landed goods, fulfillment, selling fees, and acquisition costs.
- Request carton dimensions and weight before judging a paper-product or cat-litter offer on purchase price alone.
Decision: Select the configuration with workable delivered economics. Treat the headline price as the beginning of the comparison.
4. More Listings Do Not Mean More Suppliers
The full report lists 75 supplier names across 100 products. Its four most frequent suppliers account for 19 listings. In the downloadable top 30, 22 supplier names appear.
| Supplier | Listings in the full report | Listings in the top 30 |
|---|---|---|
| Nanjing Qiyuan E-Commerce | 9 | 4 |
| Baoding Fumin Paper | 4 | 3 |
| Hubei Manhua Trading | 3 | 2 |
| Baoding Yusen Hygiene Products | 3 | 2 |
All 11 top-30 entries belonging to these four suppliers are paper products. Separately, the sleep masks ranked second and fifth both come from Nanyang Aiyuantang and both show a ¥4.63 listed price.
The Insight
- Repeated suppliers contribute to category concentration. Some of the paper-product density reflects multiple offers from the same shops.
- Two popular products can represent one supply relationship. Selecting both leading sleep masks would expand the product assortment without adding a supplier alternative.
- Consolidation and diversification are separate decisions. One supplier may simplify quoting and sample handling; an alternative supplier may improve replenishment flexibility.
What Sellers Can Do
- Group shortlisted offers by supplier name and shop link before counting alternatives.
- Compare variants within a supplier to choose the right specification; compare that specification across suppliers to evaluate price and service.
- Ask a primary and an alternative supplier for matching sample and replenishment quotes. Check their business identities and production roles when evaluating independence.
Decision: Track both product variety and supplier variety. A longer shortlist does not automatically provide more sourcing options.
5. Low MOQ Makes Comparison Easier
95 of the report’s 100 listings show a one-unit minimum. That creates many potential entry points for small sample orders, subject to the selected SKU and supplier terms.
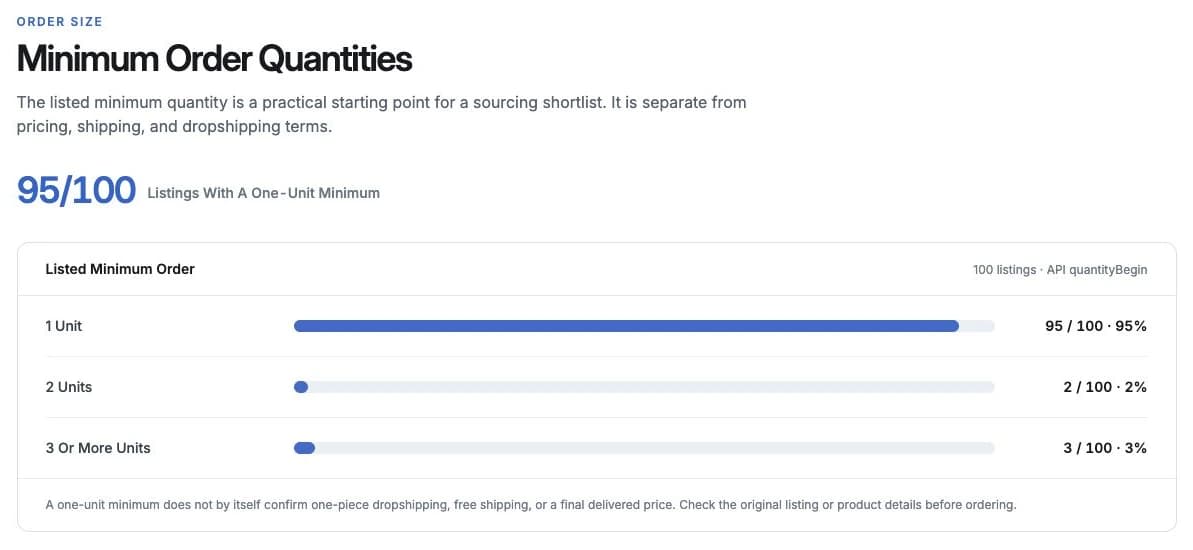
Listed minimum quantities across 100 products. Source: Nexscope October 2026 report.
The Insight
- The immediate opportunity is learning at a smaller order size. Buyers can investigate samples before deciding which specification deserves a larger order.
- MOQ and the quoted price tier need to be read together. The 26th-ranked toilet-paper listing shows a one-unit minimum, but its displayed ¥2.65 tier starts at two units.
- Sampling has greatest value when the comparison is controlled. Ordering different specifications from different suppliers makes it harder to separate product differences from supplier quality.
What Sellers Can Do
- Send the same purchase brief to the suppliers being compared: material, dimensions, packaging, and quantity.
- Confirm sample price, shipping cost, dispatch timing, and the next quantity tier in one quote.
- Score samples against the same criteria. Move the strongest candidate into a limited sales test, then review contribution, returns, and customer feedback before replenishing.
Decision: Use low minimums to compare deliberately, then concentrate inventory spending on the product that passes your checks.
What Ecommerce Sellers Should Do Next
Choose the next action based on the signal most relevant to your store:
| If you are considering… | Prioritize this test | Evidence to collect |
|---|---|---|
| Tissues or household paper | Pack specification and delivered cost | Comparable retail packs, carton dimensions, supplier and freight quotes |
| Disposable travel socks | Retail pack size | Supplier unit definition, customer use case, single-pack versus multipack economics |
| Weighted sleep masks | Product differences and sample quality | Material, weight, dimensions, stitching, packaging, customer review gaps |
| Several products from one shop | Supplier concentration | Matching quotes and samples from an alternative supplier |
A practical sequence for the next buying cycle:
- Define one customer use case. Identify the retail alternatives and a specific gap worth testing.
- Compare equivalent offers. Match SKU, pack size, quantity tier, and delivered costs.
- Inspect samples. Use a shared checklist across suppliers.
- Run a limited sales test. Set an inventory or spending limit and a review date.
- Replenish from observed results. Refresh prices, availability, and lead times; use contribution and customer feedback to guide the next order.
Conclusion
The October data points toward a sourcing approach built around specification, pack economics, and supplier selection. Paper products dominate the leading assortment, one listing drives much of the reported unit volume, and low prices sit alongside repeated suppliers and low order minimums.
For sellers, the useful next step is to turn one of those signals into a focused product test: choose a customer need, compare the exact configuration, and validate the offer through samples and sales.
Continue Your Research With Nexscope
The ranking behind this report comes from Nexscope’s 1688 Bestselling Products API. Use it to explore a product segment of your own, then investigate candidates with the rest of Nexscope’s 1688 data APIs:
- 1688 Bestselling Products API: Query bestseller rankings by period and product keyword to build a focused sourcing shortlist.
- 1688 Product Search API: Find wholesale product offers by keyword and compare candidates for sourcing.
- 1688 Search by Image API: Start with a product image URL to find visually similar supplier listings.
- 1688 Product Detail API: Inspect a selected offer’s available SKU, pricing, logistics, and supplier details.
Connect these APIs to your own agents and workflows through REST API or MCP, moving from product discovery to a more informed supplier comparison.
Research Your Next Sourcing Candidate
Explore bestseller rankings, keyword and image search, and product details to build your next 1688 sourcing shortlist.
Explore All 1688 APIs →Frequently Asked Questions
Which product led the October 2026 ranking?
The Manhua facial tissue listing led by reported orders, with 95,937 orders and 97,221 units. Its expanded details show eight SKU options, making the selected configuration important when comparing prices.
Which category stood out most?
Personal Care & Household accounted for 41 of the report’s 100 listings and 19 of the downloadable top 30. Seventeen of those top-30 entries were tissue or toilet-paper products.
Why examine orders and units separately?
They highlight different purchasing patterns. The sock listing contributed 60.9% of reported units but 4.1% of reported orders across the downloadable top 30. Check pack and unit definitions when interpreting that difference.
How should sellers compare low-priced products?
Compare equivalent retail packs using the selected SKU price, quantity tier, freight, packaging, and selling costs. Then evaluate contribution at a realistic retail price for the target channel.
How can low MOQ support product testing?
Use it to request comparable samples from shortlisted suppliers. Confirm the sample’s total delivered cost, evaluate quality against a shared checklist, and test the strongest candidate with limited inventory.
Sources
Scope: aggregate charts cover 100 report listings; row-level calculations use the 30 downloadable entries. Prices are listed values in CNY. Expanded product details were checked after October.
- Nexscope, 1688 Best-Selling Products: October 2026. Category, price, MOQ, and supplier charts.
- Nexscope, October 2026 1688 Report CSV. Product, supplier, order, unit, and price fields; calculations by Nexscope Team.
- Nexscope, 1688 Bestselling Products API. Ranking inputs and REST/MCP access.
- Nexscope, 1688 Product Detail API. Product, SKU, pricing, logistics, and supplier fields.