
Amazon FBA Fees 2027: What’s Changing for US Sellers

Table of Contents
Amazon’s November 5 announcement puts the average US FBA fulfillment fee increase at $0.19 per unit, with most changes beginning January 15, 2027. The company describes that increase as approximately 0.8% of the average item’s selling price. Product-level changes vary, including some decreases.
For sellers, the practical question is how much each product will contribute after the new charges. A modest additional cost can matter when a product already has little room for advertising, returns, or discounts. A larger increase may be manageable for a product with stronger margins and a differentiated offer.
The useful starting point is a product-level comparison. Keep fulfillment charges, storage exposure, and advertising assumptions separate so you can see what actually changed. Then decide whether to hold prices, test an increase, reduce a promotion, or revisit replenishment. This article explains the announced changes and a practical way to review them before making those decisions. It focuses on US FBA; operational suggestions and examples below are editorial guidance, not Amazon policy.
What’s Changing in Amazon FBA Fees for 2027
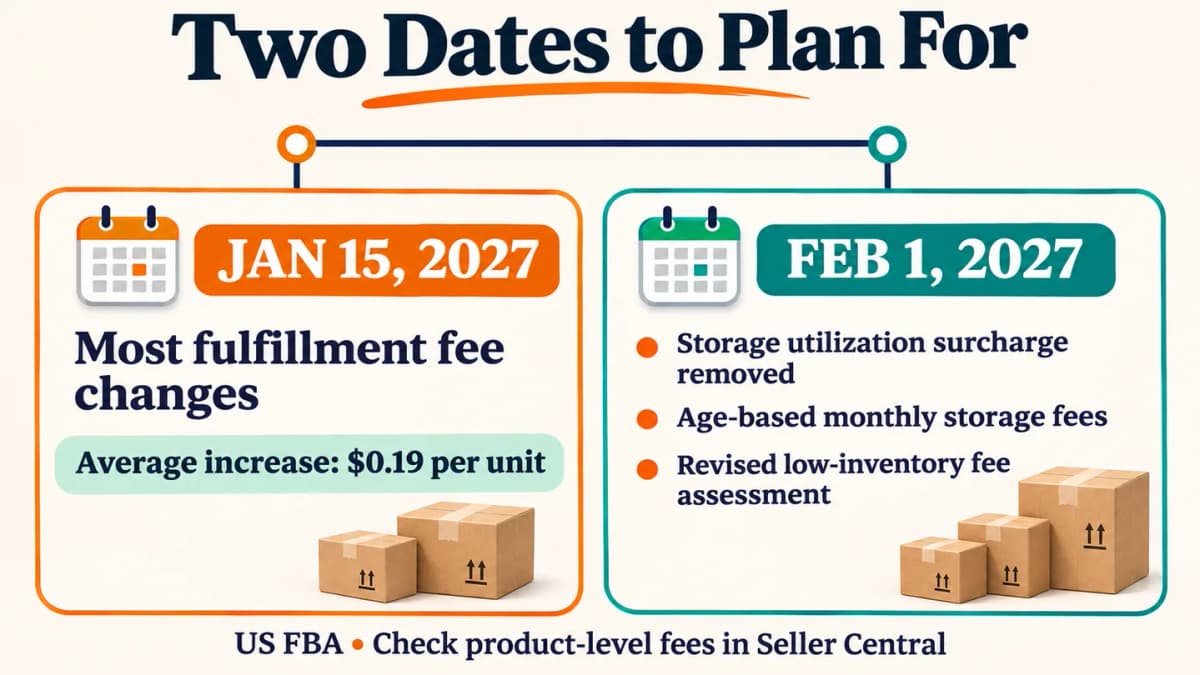
The main dates and changes are summarized below. Use the applicable Seller Central rate table for your product’s exact charge.
| Item | Announced change | Timing |
|---|---|---|
| FBA fulfillment | Average increase of $0.19 per unit | Most changes: January 15, 2027 |
| Fuel and logistics surcharge | Existing surcharge retained | No new change announced |
| Storage utilization surcharge | Eliminated | February 1, 2027 |
| Aged inventory surcharge | Combined with monthly storage in an age-based rate | February 1, 2027 |
| Low-inventory-level fee | Revised assessment | February 1, 2027 |
The existing 3.5% fuel and logistics surcharge began on April 17, 2026. It applies to fulfillment fees, so do not model it as 3.5% of the product’s selling price. When working from a calculator result or fee estimate, check whether the displayed total already includes it before adding another line.
Why the $0.19 Average Won’t Match Every Product
A catalog-wide average is a poor input for an individual product’s pricing decision. Start with the item’s actual size classification, packaged dimensions, shipping weight, selling price, and applicable rate. Keep variants separate when their physical characteristics or prices differ.
The percentage in the announcement also needs careful reading: it compares the increase with selling price, not the previous fulfillment fee. Those denominators produce very different percentages.
Compare Against the Right Baseline
Save the fee estimate, date, and assumptions used for each comparison. A change in packaging, price, or seasonal fee treatment can otherwise appear to be part of the annual increase.
Your planning sheet should distinguish:
- The current fee under a documented baseline.
- The projected fee under the new schedule.
- Any difference in product attributes or assumptions.
- Other charges included in either total.
Prioritize products by both unit economics and expected sales. A small increase on a high-volume product can have a larger monthly impact than a larger increase on a slow seller.
Illustrative Margin Impact
Suppose a product currently contributes $3.00 per unit after the costs included in your worksheet. If its verified additional cost is $0.30 and everything else stays constant, contribution falls to $2.70: a 10% reduction. At 1,000 units per month, that is $300 less contribution.
These are hypothetical figures, not Amazon rate-card values. The example shows why a small dollar change deserves a margin check before you dismiss it or apply an automatic price increase.
Storage and Low-Inventory Fee Changes From February 1
Storage Costs Follow Inventory Age
Amazon is moving to a unified, age-based monthly storage fee. Its guidance describes flat or lower fees for inventory turning in under six months and higher fees for older inventory. Removing a separate surcharge does not remove the cost of keeping aging stock.
Review inventory by age as well as by product. A healthy average sell-through rate can hide an older batch that needs attention. For each priority SKU, record units on hand, age distribution, expected demand, and the date of the next replenishment.
If older stock remains, compare the contribution from a realistic sell-through plan with the costs of continuing to hold it. A discount may be worth testing, but include the promotion cost and expected selling time. Sending more inventory before reviewing the older units can make the problem harder to resolve.
Low Inventory Uses Two Windows
The revised fee applies when days of supply are below 28 using actual shipments in both the four weeks before and four weeks after the assessment date.
Because one measurement window follows the assessment date, a forward estimate cannot fully reproduce the final result in advance. Keep your operational stock forecast separate from the fee assessment. A target of 28 days in an internal spreadsheet should not be treated as a guarantee about the charge.
Use actual replenishment lead times, shipment delays, demand variability, and service targets when deciding how much stock to carry. Chasing a single fee threshold can create a different cost elsewhere in the business.
How to Check the Impact on Your Products
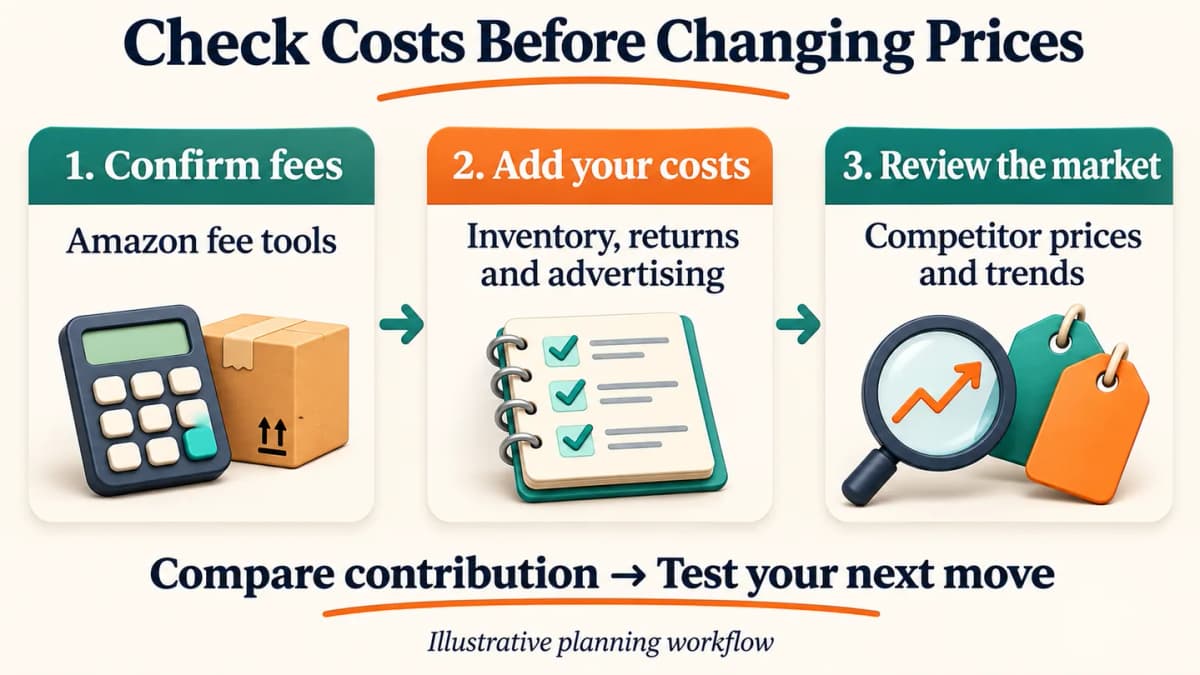
Amazon directs sellers to the Fee Change Comparison dashboard in Profit Analytics and the Revenue Calculator.
Start with the products that contribute most to revenue, have tight margins, or carry substantial older inventory. For each one:
- Identify the exact ASIN, seller SKU, and variant being reviewed.
- Confirm the size, weight, price, and fee assumptions used in the comparison.
- Record the current and projected fulfillment amounts.
- Evaluate storage separately using your actual inventory data.
- Recalculate contribution with your own product, inbound, promotion, return, and advertising costs.
A compact worksheet keeps the review actionable:
| Field | What to record |
|---|---|
| Product identifier | ASIN, SKU, and variant |
| Comparison basis | Marketplace, dates, and product assumptions |
| Fulfillment difference | Projected charge less comparable current charge |
| Inventory exposure | Units on hand and age distribution |
| Contribution | Expected amount per unit after specified costs |
| Monthly impact | Per-unit difference multiplied by a stated sales assumption |
| Decision | Hold, test pricing, review promotion, or revise replenishment |
Use your own sales history for the volume assumption where available, and label forecasts clearly. Review more than one scenario when demand is uncertain. A forecast is a planning input; actual settlements provide the later reconciliation.
What to Review Before Changing Prices or Ad Budgets
Check the Competitive Price Range
A fee increase does not establish that shoppers will accept a higher price. Compare your offer with genuinely comparable products: pack count, size, materials, delivery, coupons, and product positioning all matter.
Record both the normal price and any visible promotion. A temporary discount from one competitor is a weak basis for a permanent pricing change. Historical observations can help you separate a sustained shift from a short-lived offer.
If you test a higher price, monitor contribution alongside conversion and unit sales. More contribution per order can still produce less total contribution if demand falls enough.
Recalculate Advertising Headroom
Start with contribution before advertising:
Selling revenue minus all relevant non-advertising variable costs = contribution before advertising.
If a hypothetical $30 order leaves $6 before advertising, its simplified break-even ACoS is 20%. If an additional $0.30 cost reduces that contribution to $5.70, the threshold becomes 19%, assuming all other inputs stay constant.
This is an illustrative calculation for a single-product order with consistent revenue definitions. It is not a recommended target. A target below break-even leaves room for overhead and profit, while actual campaign decisions also require conversion, attribution, and product-mix checks.
Use the revised margin to review bids, offers, and campaign economics. Reducing every campaign’s daily budget by the same percentage can restrict profitable demand while leaving inefficient spending unresolved.
Conclusion
Build a product-level cost comparison before making a catalog-wide response. Review the items with the greatest expected contribution impact first, then decide which action addresses the specific problem. Keep a record of assumptions so you can compare projections with actual charges after implementation.
Support Pricing Decisions With Nexscope
Once the cost comparison is complete, market evidence can help you assess the commercial response. Nexscope is an ecommerce data platform that provides structured Amazon research inputs through REST API and MCP for your own applications, agents, and workflows.
Its Amazon data capabilities can help teams:
- Compare relevant competing ASINs and their pricing.
- Review supported price and product-history data over time.
- Add market signals to an internal pricing review alongside the seller’s own costs and performance data.
Coverage varies by interface. Use Amazon’s applicable fee tools and your account records for fee calculations; Nexscope supplies supporting market context. Check timestamps, preserve missing values, and label estimates before combining the inputs.
Support Your Pricing Review With Amazon Data
Compare competitor prices and product trends alongside your own verified costs.
Explore Amazon Data APIs →Frequently Asked Questions
Should I add the same amount to every product’s price?
Build an item-level comparison first. The appropriate response depends on the product’s actual fee change, contribution, demand, and competitive offer. Some products may justify a price test; others may need a promotion or inventory review.
Can I calculate the complete impact from an ASIN alone?
An ASIN identifies the product, but a full business-impact calculation also needs your own cost, inventory, promotion, return, and advertising assumptions. Check the exact variant and seller SKU before joining those records.
Does a simpler storage bill mean aging inventory is cheaper?
Do not assume so. Compare the applicable age-based rate with the inventory’s age and volume. Use the expected time to sell the remaining units when evaluating whether to hold, discount, or take another action.
Should I reduce advertising budgets immediately?
Recalculate contribution and advertising headroom first. Then review campaign performance at the relevant product level. A budget cut alone does not tell you whether the traffic you retain is profitable.
What should I verify after the changes take effect?
Compare actual charged amounts with your saved projections, using equivalent products and assumptions. Investigate differences in fee inclusion, product classification, inventory, or reporting periods before attributing the entire difference to the annual update.
Sources
- Amazon Selling Partners. 2026. Update to US Referral and Fulfillment by Amazon fees for 2027. November 5. sellingpartners.aboutamazon.com.
- Amazon Seller Central. 2026. Unified Monthly Storage Fee. US guidance reviewed November 9. sellercentral.amazon.com.
- Amazon Seller Central. 2026. Fuel and logistics-related surcharge guidance. Reviewed November 9. sellercentral.amazon.com.