
 Amazon · United States · Product Report
Top Selling Items on Amazon United States · October 2026
Overview
Explore 100 leading listings from the US product database, ranked by estimated October sales across all categories. Compare everyday essentials, personal care, and other products through their category mix, sales distribution, and brand presence.
By Nexscope · Published
The Short Version
What Stands Out
Three findings from the October dataset, with links to the supporting analysis.
2,748,991
Leading Listing · Estimated Units
Energy Drinks Lead The Source Ranking
Bloom Nutrition and Monster occupy the first two positions. Treat the source estimates as a research signal, with variant-family limits in mind.
86%
Of Ranked Listings
Three Everyday-Use Categories Dominate
Health & Household, Beauty & Personal Care, and Grocery & Gourmet Food account for 86 of the 100 listings.
234,153
Median Estimated Monthly Units
Look Beyond The Two Leading Listings
The sample median provides context for the sales threshold without treating the top listing as representative of every product.
Ask A Different Question
Build Your Own Amazon Report
Have a different question in mind? Explore Amazon data and build a report around the products, categories, and sales that matter to you.
The Ranking
Top Selling Items · October 2026
US listings ordered by the source’s estimated monthly units, with no category filter.
- 012,748,9914.624Bloom Nutrition
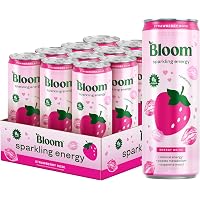 Bloom Nutrition Sparkling Energy Drink, Variety, 180mg Caffeine 12oz 12 Pack
Grocery & Gourmet Food
- Est. Units
- 2,748,991
- Rating
- 4.6
- Variants
- 24
- Brand
- Bloom Nutrition
- 022,639,5004.760Monster
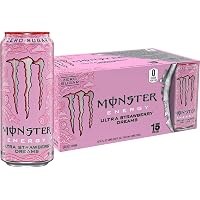 Monster Energy Ultra Strawberry Dreams, Sugar Free Energy Drink, 16 Ounce
Grocery & Gourmet Food
- Est. Units
- 2,639,500
- Rating
- 4.7
- Variants
- 60
- Brand
- Monster
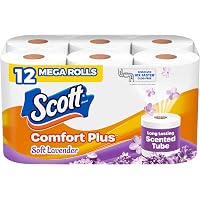
- 03600,6194.516Scott
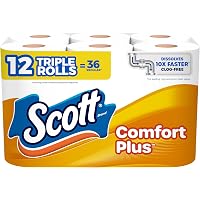
- Est. Units
- 600,619
- Rating
- 4.5
- Variants
- 16
- Brand
- Scott
- 04546,1614.68medicube
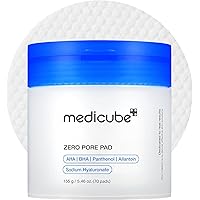 medicube Toner Pads Zero Pore Pad 2.0 for Exfoliation and Pore Care
Beauty & Personal Care
- Est. Units
- 546,161
- Rating
- 4.6
- Variants
- 8
- Brand
- medicube
- 05509,0124.86Bounty
- Est. Units
- 509,012
- Rating
- 4.8
- Variants
- 6
- Brand
- Bounty
- 06450,8464.814Nespresso
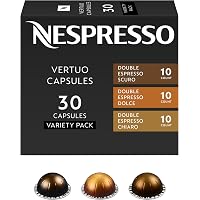 Nespresso Vertuo, Double Espresso Variety Pack, Mixed Roast, 30-Count Pods
Grocery & Gourmet Food
- Est. Units
- 450,846
- Rating
- 4.8
- Variants
- 14
- Brand
- Nespresso
- 07446,1114.624CELSIUS
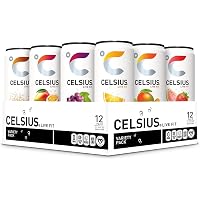
- Est. Units
- 446,111
- Rating
- 4.6
- Variants
- 24
- Brand
- CELSIUS
- 08425,0954.86Bounty
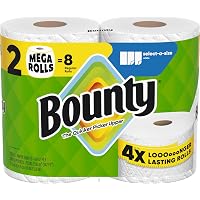 Bounty Select-A-Size Paper Towels, White, 2 Mega Rolls = 8 Regular Rolls
Health & Household
- Est. Units
- 425,095
- Rating
- 4.8
- Variants
- 6
- Brand
- Bounty
- 09411,1724.69Mighty Patch
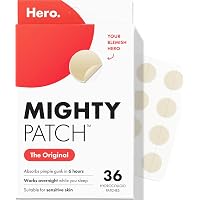 Mighty Patch Hero Cosmetics Original Nighttime Acne Pimple Patches, 36 Ct
Beauty & Personal Care
- Est. Units
- 411,172
- Rating
- 4.6
- Variants
- 9
- Brand
- Mighty Patch
- 10390,1254.72Amazon Essentials
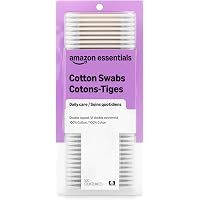 Amazon Essentials Cotton Swabs, 500 Count (Previously Amazon Basics)
Beauty & Personal Care
- Est. Units
- 390,125
- Rating
- 4.7
- Variants
- 2
- Brand
- Amazon Essentials
- 11378,1484.814CLEAN SKIN CLUB
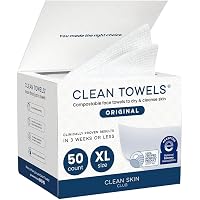
- Est. Units
- 378,148
- Rating
- 4.8
- Variants
- 14
- Brand
- CLEAN SKIN CLUB
- 12377,2124.57BIODANCE
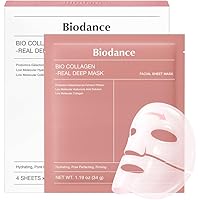 BIODANCE Bio-Collagen Real Deep Mask for Hydrating & Plumping (4ea)
Beauty & Personal Care
- Est. Units
- 377,212
- Rating
- 4.5
- Variants
- 7
- Brand
- BIODANCE
- 13374,8594.61SCOTTS FOOD PRODUCTS
- Est. Units
- 374,859
- Rating
- 4.6
- Variants
- 1
- Brand
- SCOTTS FOOD PRODUCTS
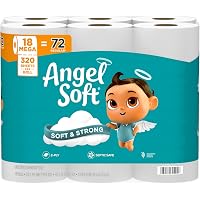
- 14371,3264.89Angel Soft
- Est. Units
- 371,326
- Rating
- 4.8
- Variants
- 9
- Brand
- Angel Soft
- 15371,2644.51Fresh Produce (Brands May Vary)
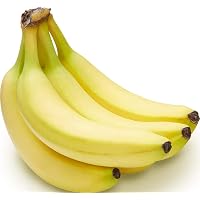 Banana Bunch (4-5 Count)
Grocery & Gourmet Food
- Est. Units
- 371,264
- Rating
- 4.5
- Variants
- 1
- Brand
- Fresh Produce (Brands May Vary)
- 16370,2344.41SCOTTS FOOD PRODUCTS
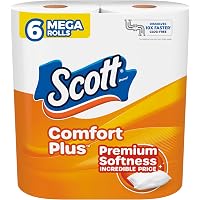
- Est. Units
- 370,234
- Rating
- 4.4
- Variants
- 1
- Brand
- SCOTTS FOOD PRODUCTS
- 17369,6094.89Mighty Patch
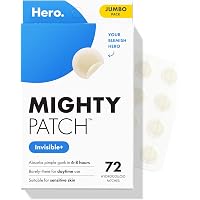 Hero Cosmetics Mighty Patch Invisible+ Daytime Acne Pimple Patch, 72 Ct
Beauty & Personal Care
- Est. Units
- 369,609
- Rating
- 4.8
- Variants
- 9
- Brand
- Mighty Patch
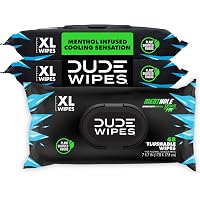
- 18348,8524.722DUDE Wipes
- Est. Units
- 348,852
- Rating
- 4.7
- Variants
- 22
- Brand
- DUDE Wipes
- 19333,0454.713Cottonelle
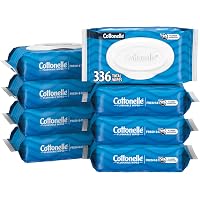
- Est. Units
- 333,045
- Rating
- 4.7
- Variants
- 13
- Brand
- Cottonelle
- 20332,5664.76Georgia-Pacific
- Est. Units
- 332,566
- Rating
- 4.7
- Variants
- 6
- Brand
- Georgia-Pacific
- 21325,5064.82Neutrogena
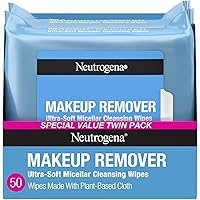 Neutrogena Makeup Remover Wipes, 2 Pack of 25 Ct
Beauty & Personal Care
- Est. Units
- 325,506
- Rating
- 4.8
- Variants
- 2
- Brand
- Neutrogena
- 22321,4174.72Amazon Essentials
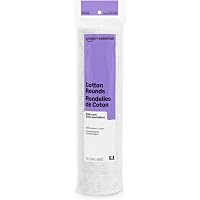 Amazon Essentials 100% Cotton Rounds, 100 Count (Previously Amazon Basics)
Beauty & Personal Care
- Est. Units
- 321,417
- Rating
- 4.7
- Variants
- 2
- Brand
- Amazon Essentials
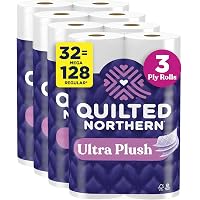
- 23320,2934.87Charmin
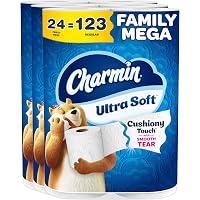
- Est. Units
- 320,293
- Rating
- 4.8
- Variants
- 7
- Brand
- Charmin
- 24317,6764.61medicube
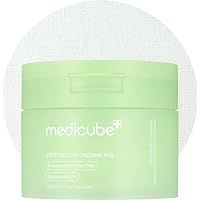
- Est. Units
- 317,676
- Rating
- 4.6
- Variants
- 1
- Brand
- medicube
- 25314,1004.819Premier Protein
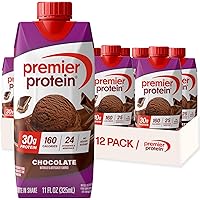 Premier Protein 30g High Protein Shake, Chocolate, 12 Pack
Grocery & Gourmet Food
- Est. Units
- 314,100
- Rating
- 4.8
- Variants
- 19
- Brand
- Premier Protein
- 26308,7584.73Pure Encapsulations
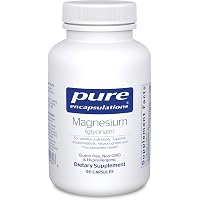 Pure Encapsulations Magnesium (Glycinate), 90 Capsules
Health & Household
- Est. Units
- 308,758
- Rating
- 4.7
- Variants
- 3
- Brand
- Pure Encapsulations
- 27307,9044.64La Roche-Posay
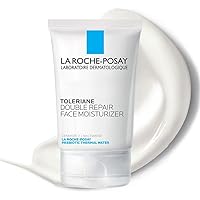 La Roche-Posay Toleriane Double Repair Face Moisturizer
Beauty & Personal Care
- Est. Units
- 307,904
- Rating
- 4.6
- Variants
- 4
- Brand
- La Roche-Posay
- 28303,2824.611Miss Mouth's
- Est. Units
- 303,282
- Rating
- 4.6
- Variants
- 11
- Brand
- Miss Mouth's
- 29295,7654.61SCOTTS FOOD PRODUCTS
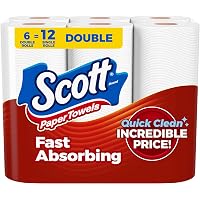 Scott Paper Towels, Choose-A-Sheet, 6 Double Rolls, 108 Sheets Per Roll
Health & Household
- Est. Units
- 295,765
- Rating
- 4.6
- Variants
- 1
- Brand
- SCOTTS FOOD PRODUCTS
- 30292,9654.43Dr. Elsey's
- Est. Units
- 292,965
- Rating
- 4.4
- Variants
- 3
- Brand
- Dr. Elsey's
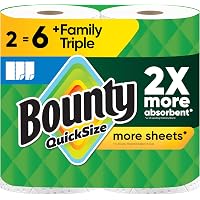
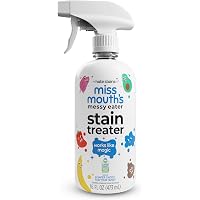
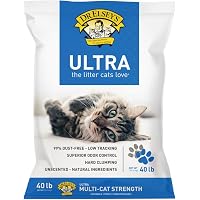
Estimated monthly units from the October 2026 source ranking. Variant counts and ratings are reference fields from the same response; units are not independently verified child-ASIN sales.
Continue Your Research
Explore More Product Segments
Explore another market or category and build a product shortlist with Nexscope APIs.
Category Mix
Everyday Essentials Shape The List
Category counts cover all 100 ranked listings; missing category data remains visible as Unknown.
Hover or tap a segment to explore
View All 10 Categories
Groups representing at least 3% of the sample are shown separately. Other combines 5 smaller groups. Counts cover all 100 products in this report, not marketplace share.
Explore A Category
Narrow The Search To Your Market
Use category filters to investigate a specific segment after reviewing the broad ranking.
Sales Distribution
October Estimated Sales (Units Sold)
How many units each ranked product is estimated to have sold in October 2026. Bars show the number of listings in each sales band.
234,153median estimated monthly units
Under 250K
250K–under 400K
400K–under 1M
1M and above
Estimated units per listing
All 100 source-ranked listings. Estimates may reflect source variant-family aggregation; do not add them together as a market sales total.
Validate A Shortlist
Investigate The Products Behind The Numbers
Compare listing attributes and source estimates before selecting products for deeper research.
Brand Landscape
Brand Presence Across The Ranking
Exact source brand labels are grouped by listing count; this is not brand revenue or market share.
69distinct brand labels
Brand Labels By Listing Count
Across all 100 ranked products- 01SCOTTS FOOD PRODUCTS5 products
- 02Amazon Basics4 products
- 03Charmin4 products
- 04Fresh Produce (Brands May Vary)4 products
- 05medicube4 products
- 06Apple3 products
- 07Bounty3 products
- 08Ailun2 products
- 09Amazon Essentials2 products
- 10BIODANCE2 products
- 11CGK Unlimited2 products
- 12Core Power2 products
- 13Dawn2 products
- 14Mighty Patch2 products
- 15Native2 products
Showing 15 of 69 brand labels
Competitive Research
Explore A Brand’s Product Range
Use supported brand filters to examine listings beyond this report sample.
Research Notes
Data Sources & Methodology
The sources and scope behind this October Amazon report.
Data Sources
The ranking uses the Amazon Broad Product Search API, backed by SellerSprite. The historical response supplies estimated monthly units, listing identities, categories, and brand labels for October 2026. For AI assistant integration, see the Amazon Broad Product Search MCP documentation.
Ranking & Scope
The analysis covers the first 100 US listings returned in descending estimated monthly-unit order, without category, keyword, or seller-country restrictions. The historical month is October 2026; the provider does not expose its month-end cutoff timezone. Delisted products are not deliberately filtered out.
Charts & Metrics
Category, brand, and unit-band charts use all 100 listings. Two missing category paths remain Unknown. Brand labels are matched exactly. Current reference prices are excluded from historical-price claims; revenue and growth fields are not used in the analysis.
Limits & Names
These are third-party estimates from a product database, not an official Amazon-wide census. Variation suppression is enabled, but parent identities are unavailable for independent family deduplication. Original source product and brand names are retained, and listing sales are not summed into a market total.
FAQ
Frequently Asked Questions
Practical answers about Amazon product rankings and evaluating products for further research.
What Are The Top Selling Items On Amazon In This Report?
Bloom Nutrition Sparkling Energy Drink leads this October 2026 US source ranking with 2,748,991 estimated monthly units, followed by Monster Energy Ultra Strawberry Dreams. These are provider-reported estimates for ranked listings, not independently audited sales or an official Amazon-wide leaderboard.
Which Categories Appear Most Often?
Health & Household accounts for 38 of the 100 ranked listings, followed by Beauty & Personal Care with 27 and Grocery & Gourmet Food with 21. Together they represent 86% of this sample by listing count. These proportions describe the report sample, not Amazon market share.
How Can I Use This List To Research Products To Sell?
Start with listings relevant to your audience, then compare their category, brand, and estimated sales. Check current competition, fulfillment costs, product restrictions, and your own margin assumptions before shortlisting. A high position measures reported sales volume; it does not establish profitability or an easy market to enter.
Is The Ranking Based On BSR Or Estimated Sales?
The ranking uses the source’s estimated monthly units in descending order. It does not compare BSR across categories: a category-specific rank cannot be treated as a universal sales measure. The query includes all categories available in the source’s US product database.
How Are Product Variants Handled?
The query uses the source’s variation-suppression setting, and all 100 returned ASINs are unique. However, the response does not provide parent-ASIN identities, so family-level deduplication and the allocation of sales between child variants cannot be independently verified. The report therefore avoids summing listing sales into a market total.
Does This Cover October Or The Last 30 Days?
This edition uses the historical October 2026 monthly dataset, rather than the rolling last-30-days option. The source returned October 2026 for the dataset and every ranked item. The provider does not expose its precise month-end cutoff timezone, and these figures remain third-party estimates.
Why Are Historical Price And Revenue Charts Not Included?
The product-search contract describes the returned price as a current price, so this report does not present it as October’s average selling price. Revenue, profit, and growth measures are also excluded from the analysis until their semantics are validated. The charts focus on ranked listings, categories, and estimated units.
Turn Rankings into a Shortlist.Make Your Next Move.
Explore Amazon product data by market, month, and category for your next research question.