
 Amazon · United States · Trending Report
Amazon Trending Products United States · October 2026
Overview
Explore 100 US products from the October 2026 dataset, ordered by the API’s sales-growth field across all categories. Compare estimated monthly sales, category mix, and brand presence. The source growth values are preserved as returned; their comparison baseline and formula have not been verified.
By Nexscope · Published
The Short Version
What Stands Out
Three findings from the October dataset, with links to the supporting analysis.
55%
Across Three Leading Categories
Clothing, Beauty And Home Account For Over Half
Clothing, Shoes & Jewelry contributes 20 listings, Beauty & Personal Care 19, and Home & Kitchen 16 in the October trend ranking.
61%
Below 10,000 Estimated Units
Most Trending Listings Are Still Smaller Sellers
61 of the 100 listings have fewer than 10,000 estimated October units. A high source growth rank does not necessarily mean a large sales volume.
2.64M
Estimated October Units
Monster Combines The Top Trend Rank With High Sales
Monster Energy Ultra Strawberry Dreams leads the source growth ranking and records about 2.64 million estimated October units.
Ask A Different Question
Build Your Own Amazon Report
Have a different question in mind? Explore Amazon data and build a report around the products, categories, and sales that matter to you.
The Ranking
Trending Products · October 2026
October US products in source growth order, with estimated monthly sales and source-reported growth values.
- 012,639,500+23,995,354%4.7Monster
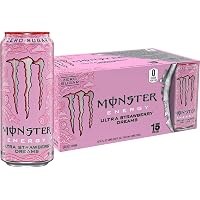 Monster Energy Ultra Strawberry Dreams, Sugar Free Energy Drink, 16 Ounce
Grocery & Gourmet Food
- Oct Units
- 2,639,500
- Source Growth %
- +23,995,354%
- Rating
- 4.7
- Brand
- Monster
- 02159,666+16,477,000%4.7CeraVe
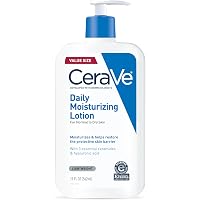 CeraVe Daily Moisturizing Lotion, Face and Body Lotion, Skin care, 19oz
Beauty & Personal Care
- Oct Units
- 159,666
- Source Growth %
- +16,477,000%
- Rating
- 4.7
- Brand
- CeraVe
- 03104,714+3,607,267.2%4.7Optimum Nutrition
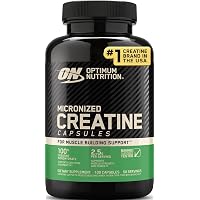 Optimum Nutrition Micronized Creatine Monohydrate Capsules, 100 Ct
Health & Household
- Oct Units
- 104,714
- Source Growth %
- +3,607,267.2%
- Rating
- 4.7
- Brand
- Optimum Nutrition
- 0421,452+2,145,100%4.4COPYLEAF
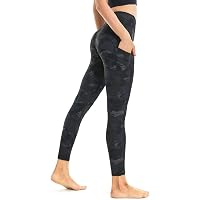
- Oct Units
- 21,452
- Source Growth %
- +2,145,100%
- Rating
- 4.4
- Brand
- COPYLEAF
- 0535,651+1,536,600%4.2DORALLURE
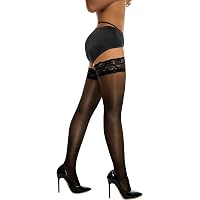
- Oct Units
- 35,651
- Source Growth %
- +1,536,600%
- Rating
- 4.2
- Brand
- DORALLURE
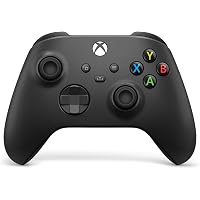
- 0639,935+1,310,267%4.5Xbox
- Oct Units
- 39,935
- Source Growth %
- +1,310,267%
- Rating
- 4.5
- Brand
- Xbox
- 0714,771+1,224,400%4.3NexiEpoch
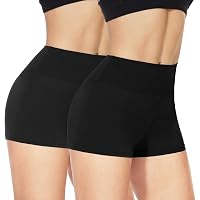
- Oct Units
- 14,771
- Source Growth %
- +1,224,400%
- Rating
- 4.3
- Brand
- NexiEpoch
- 0833,374+1,166,533%4.6HALO
- Oct Units
- 33,374
- Source Growth %
- +1,166,533%
- Rating
- 4.6
- Brand
- HALO
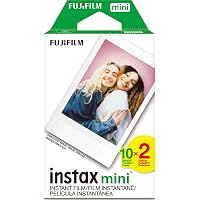
- 0955,671+1,161,160%4.8Fujifilm
- Oct Units
- 55,671
- Source Growth %
- +1,161,160%
- Rating
- 4.8
- Brand
- Fujifilm
- 1013,536+1,103,057%4.6DOVE MEN + CARE
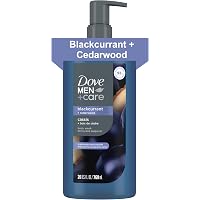 DOVE MEN Moisturizing Body Wash for Men, Blackcurrant + Cedarwood, 26 oz
Beauty & Personal Care
- Oct Units
- 13,536
- Source Growth %
- +1,103,057%
- Rating
- 4.6
- Brand
- DOVE MEN + CARE
- 1195,156+1,103,057%4.6DOVE MEN + CARE
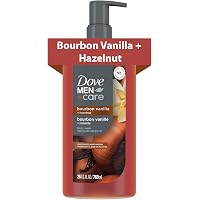 DOVE MEN Moisturizing Body Wash for Men, Bourbon Vanilla + Hazelnut, 26oz
Beauty & Personal Care
- Oct Units
- 95,156
- Source Growth %
- +1,103,057%
- Rating
- 4.6
- Brand
- DOVE MEN + CARE
- 12998+988,800%4.8Purina Moist & Meaty
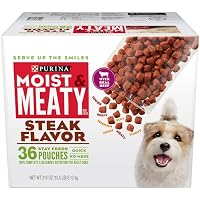 Purina Moist & Meaty Dog Food, Steak, 216 Ounce
Pet Supplies
- Oct Units
- 998
- Source Growth %
- +988,800%
- Rating
- 4.8
- Brand
- Purina Moist & Meaty
- 1310,050+974,000%4.3B&Qaugen
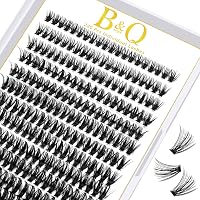 B&Q 40D D-Curl Lash Clusters 280PCS DIY Wispy Cat Eye Extensions
Beauty & Personal Care
- Oct Units
- 10,050
- Source Growth %
- +974,000%
- Rating
- 4.3
- Brand
- B&Qaugen
- 143+967,100%2.4LOMON
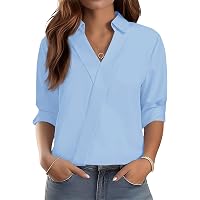 LOMON Womens Tops 3/4 Sleeve V Neck Collared Shirts Dressy Casual Blouses
Clothing, Shoes & Jewelry
- Oct Units
- 3
- Source Growth %
- +967,100%
- Rating
- 2.4
- Brand
- LOMON
- 159,491+967,100%4LOMON
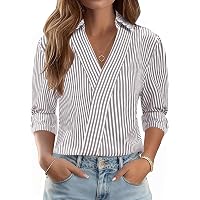 LOMON 3/4 Length Sleeve Womens Tops Dressy V Neck Collared Dress Shirts
Clothing, Shoes & Jewelry
- Oct Units
- 9,491
- Source Growth %
- +967,100%
- Rating
- 4
- Brand
- LOMON
- 1617,183+959,350%2.5GAYHAY
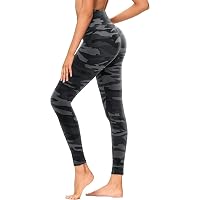
- Oct Units
- 17,183
- Source Growth %
- +959,350%
- Rating
- 2.5
- Brand
- GAYHAY
- 1710,848+941,900%4.8Zeagoo
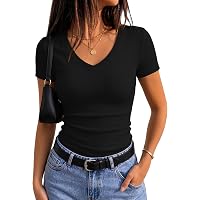 Zeagoo Women Short Sleeve Tops V Neck Shirt Ribbed Basic Tee Summer Outfits
Clothing, Shoes & Jewelry
- Oct Units
- 10,848
- Source Growth %
- +941,900%
- Rating
- 4.8
- Brand
- Zeagoo
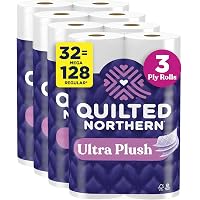
- 18332,566+925,795%4.7Georgia-Pacific
- Oct Units
- 332,566
- Source Growth %
- +925,795%
- Rating
- 4.7
- Brand
- Georgia-Pacific
- 1958,299+860,371%4.7Atkins
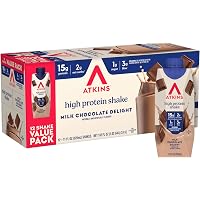
- Oct Units
- 58,299
- Source Growth %
- +860,371%
- Rating
- 4.7
- Brand
- Atkins
- 2010,439+854,500%4.4PLANTIFIQUE
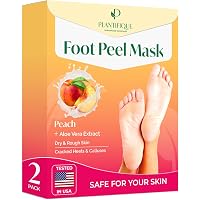 PLANTIFIQUE Foot Peeling Mask, Dermatologically Tested - 2 Pairs, Peach
Beauty & Personal Care
- Oct Units
- 10,439
- Source Growth %
- +854,500%
- Rating
- 4.4
- Brand
- PLANTIFIQUE
- 21120,923+775,094%4.7Peet's Coffee
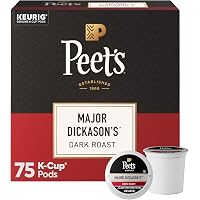 Peet's Coffee Coffee Pods, Dark Roast, Major Dickason's Blend, 75 K Cups
Grocery & Gourmet Food
- Oct Units
- 120,923
- Source Growth %
- +775,094%
- Rating
- 4.7
- Brand
- Peet's Coffee
- 2216,264+694,950%4.4RICAF
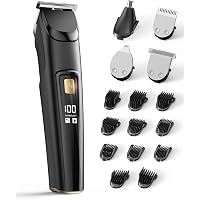 Beard Trimmer for Men,4-in-1 Hair Clipper Kit,18 Lengths,Gift for Men
Beauty & Personal Care
- Oct Units
- 16,264
- Source Growth %
- +694,950%
- Rating
- 4.4
- Brand
- RICAF
- 239,590+644,300%4.6REVLON
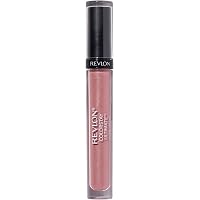 Revlon ColorStay Ultimate Liquid Lipstick, 035 Iconic Iris, 0.1 fl oz
Beauty & Personal Care
- Oct Units
- 9,590
- Source Growth %
- +644,300%
- Rating
- 4.6
- Brand
- REVLON
- 246,519+599,300%4.6Smilco

- Oct Units
- 6,519
- Source Growth %
- +599,300%
- Rating
- 4.6
- Brand
- Smilco
- 25221,960+598,934%4.6Vital Proteins
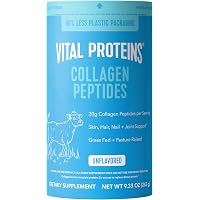 Vital Proteins Collagen Peptides Powder, Unflavored, 9.33oz
Health & Household
- Oct Units
- 221,960
- Source Growth %
- +598,934%
- Rating
- 4.6
- Brand
- Vital Proteins
- 2611,605+590,450%4.4TOG999
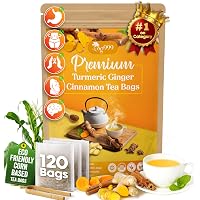 TOG999 Turmeric Ginger Cinnamon Tea Bags, Caffeine-Free Herbal Tea, 120 Ct
Grocery & Gourmet Food
- Oct Units
- 11,605
- Source Growth %
- +590,450%
- Rating
- 4.4
- Brand
- TOG999
- 275,878+576,100%4.7Sparklove
- Oct Units
- 5,878
- Source Growth %
- +576,100%
- Rating
- 4.7
- Brand
- Sparklove
- 286,052+575,100%4.7Blazy Susan
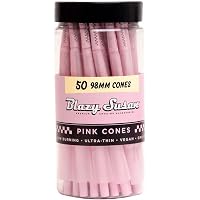 Blazy Susan Pre Rolled Cones 50 Count (Pink)
Health & Household
- Oct Units
- 6,052
- Source Growth %
- +575,100%
- Rating
- 4.7
- Brand
- Blazy Susan
- 295,565+564,100%4.8BOGG BAG
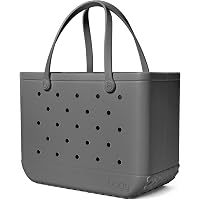
- Oct Units
- 5,565
- Source Growth %
- +564,100%
- Rating
- 4.8
- Brand
- BOGG BAG
- 3032,028+561,033%4.4Diaclara
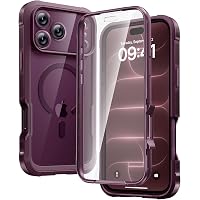 Diaclara Magnetic & Screen Protector for iPhone 18 Pro Max Case Burgundy
Cell Phones & Accessories
- Oct Units
- 32,028
- Source Growth %
- +561,033%
- Rating
- 4.4
- Brand
- Diaclara
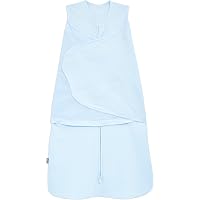
October 2026 estimated units. Source Growth % is the API-reported field, preserved as returned. Its baseline and formula are unverified; it is not a verified September-to-October change.
Continue Your Research
Explore More Product Segments
Explore another market or category and build a product shortlist with Nexscope APIs.
Category Mix
Category Mix Across The Ranking
Category counts cover all 100 returned listings; missing category data remains visible as Unknown.
Hover or tap a segment to explore
View All 17 Categories
Groups representing at least 3% of the sample are shown separately. Other combines 6 smaller groups. Counts cover all 100 products in this report, not marketplace share.
Explore A Category
Narrow The Search To Your Market
Use category filters to investigate a specific segment after reviewing the broad ranking.
Sales Distribution
October Estimated Sales (Units Sold)
How many units each ranked product is estimated to have sold in October 2026. Bars show the number of listings in each sales band.
5,721.5median October estimated units
Under 1,000
1,000–9,999
10,000–99,999
100,000 and above
Estimated units per listing
All 100 returned listings are included, including zero estimates. This distribution is not Amazon-wide market share.
Validate A Shortlist
Investigate The Products Behind The Numbers
Compare listing attributes and source estimates before selecting products for deeper research.
Brand Landscape
Brand Presence Across The Ranking
Exact source brand labels are grouped by listing count; this is not brand revenue or market share.
86distinct brand labels
Brand Labels By Listing Count
Across all 100 ranked products- 01Zeagoo4 products
- 02Bedsure3 products
- 03DIVOAZBVO3 products
- 04DOVE MEN + CARE2 products
- 05LOMON2 products
- 06Layoeum2 products
- 07aowoka2 products
- 08SOBIY2 products
- 09CAROTE2 products
- 10GARUTED2 products
- 11Monster1 Product
- 12CeraVe1 Product
- 13Optimum Nutrition1 Product
- 14COPYLEAF1 Product
- 15DORALLURE1 Product
Showing 15 of 86 brand labels
Competitive Research
Explore A Brand’s Product Range
Use supported brand filters to examine listings beyond this report.
Research Notes
Data Sources & Methodology
The sources and scope behind this October Amazon report.
Data Source
The Amazon Broad Product Search API supplies the US October 2026 dataset. The request uses dataSnapshotMonth 202610 and sorts by total_units_growth descending. No category filter is applied. For AI assistant integration, see the Amazon Broad Product Search MCP documentation.
Ranking & Scope
We retain the first 100 results in the order returned by the API. No additional minimum-sales, parent-identity or growth-threshold rules are applied. Trending is this report’s description of the source growth ranking, not a separate Amazon official chart.
Charts & Metrics
Source Growth % displays monthlySalesUnitsGrowthRate unchanged. Its baseline and formula are unverified, and extreme values occur; do not interpret it as a verified September-to-October change. Sales charts use October estimated units. All category and brand counts use the same 100 listings.
Limits & Names
These are third-party product-database estimates, not audited orders or an Amazon-wide census. Coverage and variant handling follow the source response; listings are not deduplicated by parent. Source growth rank is a research signal, not proof of durable demand. Original product and brand names are retained.
FAQ
Frequently Asked Questions
Practical answers about Amazon product trends and evaluating emerging opportunities.
Which Product Leads The October Trending Ranking?
Monster Energy Ultra Strawberry Dreams ranks first in the October US response sorted by the source sales-growth field. This describes the returned product database ranking, not an official Amazon-wide chart.
How Is Trending Different From Best Selling?
The best-selling report sorts by estimated monthly units. This report sorts by the source sales-growth field. A high trend rank does not necessarily mean high sales; October estimated units are shown alongside the source growth values.
Does Source Growth Mean October Growth Versus September?
That interpretation has not been verified. The API labels this field as monthly sales growth rate, but its comparison baseline and formula are not established in the available documentation. Values are preserved as returned, including extreme values; they are not our calculated month-over-month percentages.
Are Low-Sales Products Removed?
No. This report retains the first 100 returned products without adding minimum-sales thresholds, growth thresholds or parent-identity checks. Zero estimated sales are retained when returned by the source.
How Can I Use The Category And Brand Analysis?
Use the counts to see which categories and source brand labels appear in these 100 listings, then investigate relevant products. Counts represent listings in this ranking, not category growth, brand revenue or market share.
Does A High Trending Rank Mean Demand Will Keep Rising?
No. Review longer sales history, promotions, seasonality, availability, variants and margins before selecting a product. An extreme source growth value alone is not evidence of a durable opportunity.
Is There A Separate Amazon Trending API Behind This Report?
No. This report uses Amazon Broad Product Search with the October 2026 month parameter and the total_units_growth descending sort. It retains the first 100 returned US products across categories.
Turn Rankings into a Shortlist.Make Your Next Move.
Explore Amazon product data by market, month, and category for your next research question.