

How to Do TikTok Shop Analytics in 5 Steps

Table of Contents
TikTok Shop analytics becomes useful when a change in sales leads to a specific question: which product changed, where did the change happen, and what should the seller check next? A lower GMV total alone cannot tell a team whether to adjust a listing, restore stock, contact creators, or review a promotion. Changing all four at once also makes the next week's results harder to interpret. The first task is to narrow the problem enough to choose a useful action.
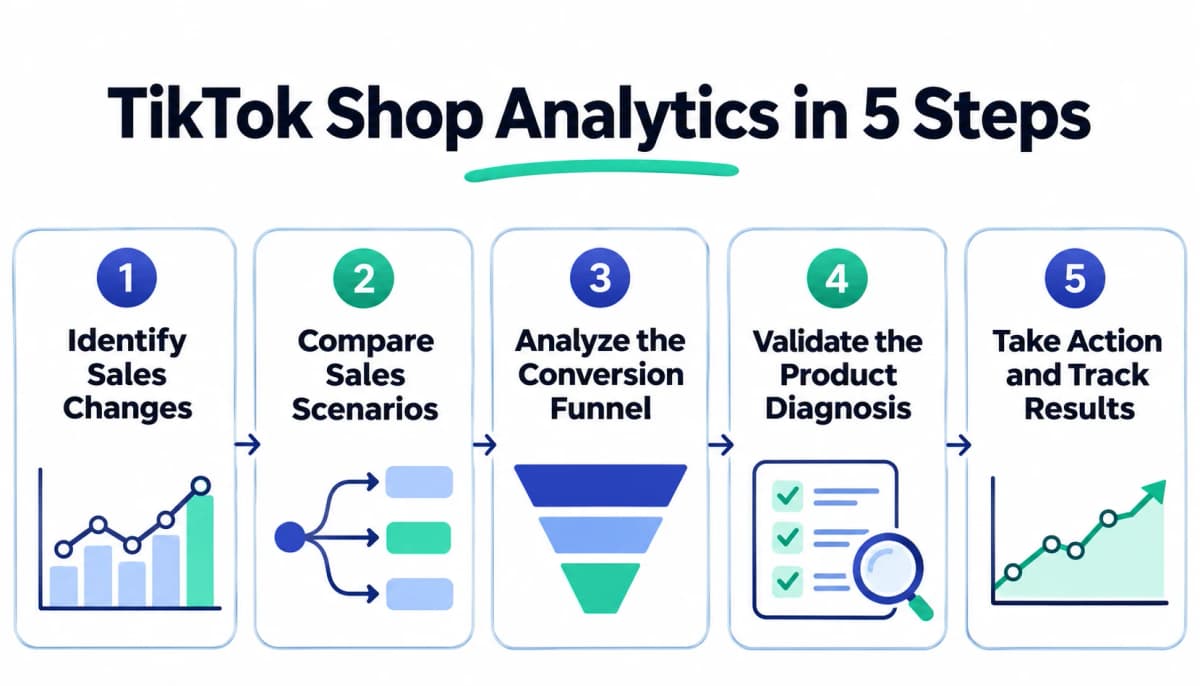
This five-step workflow starts with the shop's own performance, follows the change into individual products and sales scenarios, and ends with a measured response. It also explains where Product Diagnosis fits into that process. Start with one important product, use a consistent reporting period, and keep the evidence behind each decision. A short analysis that leads to a verifiable improvement is more useful than a report containing every available metric.
What TikTok Shop Analytics Can Tell You
TikTok Shop analytics connects sales outcomes with product, traffic, and content performance. Start with the shop's overall sales trend to see whether orders, GMV, or average order value changed. Then review individual products and SKUs to identify where the movement is concentrated. Traffic and content views help narrow the investigation to discovery, clicks, purchase conversion, or selling activity.
| Question | Starting point | Useful next question |
|---|---|---|
| Did the shop's performance change? | Overall sales metrics | Which products contributed most? |
| Which product needs investigation? | Product-level performance | Which scenario changed? |
| Where are shoppers dropping out? | Traffic and conversion metrics | What changed at that stage? |
| What might need fixing? | Product Diagnosis | Which evidence supports the finding? |
Keep first-party results separate from external market estimates. Seller Center is the reference for the shop's own reported performance. Public competitor information adds context, but cannot reproduce a competitor's private conversion funnel.
Step 1. Identify Sales Changes
Set a Comparable Period
Choose two complete periods of the same length. For a weekly review, compare the latest seven complete days with the preceding seven, then note anything that makes the comparison unusual: a promotion, a stock interruption, a holiday, or a major creator placement.
Record the market, currency, reporting dates, and the metric definition. Avoid comparing today's partial results with a completed day. For low-volume products, a longer window may provide a more useful basis for investigation, provided it does not hide a recent operational problem.
GMV is a sales measure, not a profit calculation. Keep refunds, acquisition costs, creator commissions, fulfillment costs, and other expenses in the commercial review. A promotion can raise sales while reducing the money retained from each order.
Prioritize Material Changes
Review both the amount and percentage of a change. A product falling from $100 to $50 has lost 50%, but a product falling from $10,000 to $8,000 has a much larger effect on the shop.
The following is an illustrative example, not actual seller data:
| Product | Previous GMV | Current GMV | Change | Change rate |
|---|---|---|---|---|
| Product A | $10,000 | $8,000 | −$2,000 | −20% |
| Product B | $100 | $50 | −$50 | −50% |
| Product C | $2,000 | $2,500 | +$500 | +25% |
Across these three products, GMV fell by $1,550. Product A lost more than that net amount because Product C offset part of the decline. Investigating A first is a reasonable priority. Product B may still need attention, especially if it has an operational issue, but its percentage decline should not dominate the review.
Use Attention Flags Carefully
In the updated U.S. Product Performance view, Need attention requires both negative real-time GMV change and an offline diagnosis that identifies a problem. An absent flag does not establish that a product is performing well. Use it to prioritize checks alongside commercial importance. The flag helps prioritize investigation; it does not replace a review of the underlying metrics.
For an external product comparison, use the TikTok Product Analytics API to retrieve available product prices, sales volume, and revenue for a selected market and period. Preserve the source metric definitions when comparing revenue with Seller Center GMV.
Output: one priority product, a comparable period, and a clear statement of what changed.
Step 2. Compare Sales Scenarios
For that product, examine the change by scenario. The updated diagnosis uses Creator LIVE, Creator Video, Seller LIVE, Seller Video, and Shop Tab & Search. These describe selling scenarios; they should not be treated as a direct paid-versus-organic advertising split.
| Scenario | First check | Follow-up investigation |
|---|---|---|
| Creator LIVE | Creator and livestream activity | Whether the same creators and products remained active |
| Creator Video | Video activity and results | Whether a previous high-performing video stopped contributing |
| Seller LIVE | Broadcast activity and results | Changes in schedule, assortment, offers, or stock |
| Seller Video | Publishing activity and results | Changes in creative approach, product availability, or audience response |
| Shop Tab & Search | Product traffic and conversion | Where impressions, clicks, or orders weakened |
For external LIVE comparisons, the TikTok Livestream Analytics API provides available sales revenue, viewer, and product-sales signals. Compare broadcasts from the same market and reporting period, then inspect their duration and product mix before interpreting differences in performance.
Separate Volume and Efficiency
A decline can occur because fewer selling opportunities were created, because each opportunity produced less, or because both happened together.
For example, suppose a seller published fewer videos during the current period. Before calling the product less appealing, check whether the remaining videos also performed worse on a comparable basis. Conversely, steady publishing volume with weaker results calls for a closer review of the content, offer, and traffic.
Content age matters. A video published yesterday has had less time to accumulate results than one published a week ago. Compare similar observation windows where possible and note when the available report cannot support that comparison.
Inspect the Underlying Mix
Check whether activity is concentrated in a small number of creators, pieces of content, or SKUs. An overall average can hide the disappearance of one important contributor. Compare the sales-channel mix of relevant accounts in the U.S. TikTok Shop top-selling creators report with the mix supporting the product. This can highlight whether video or LIVE deserves closer investigation when reviewing creator partnerships. Keep the report's November 4, 2026 snapshot period in mind when making the comparison.
For each leading contributor, record what visibly changed: posting activity, a promotion, product availability, or the assortment being featured. Treat each observation as evidence to investigate. A simultaneous change does not establish causation. When the question concerns creative effectiveness, TikTok ad and video analysis can help compare content angles alongside commerce signals before selecting the next creative test.
Output: the scenario and contributors that deserve a closer look, with separate hypotheses about activity volume and effectiveness.
Step 3. Analyze the Conversion Funnel
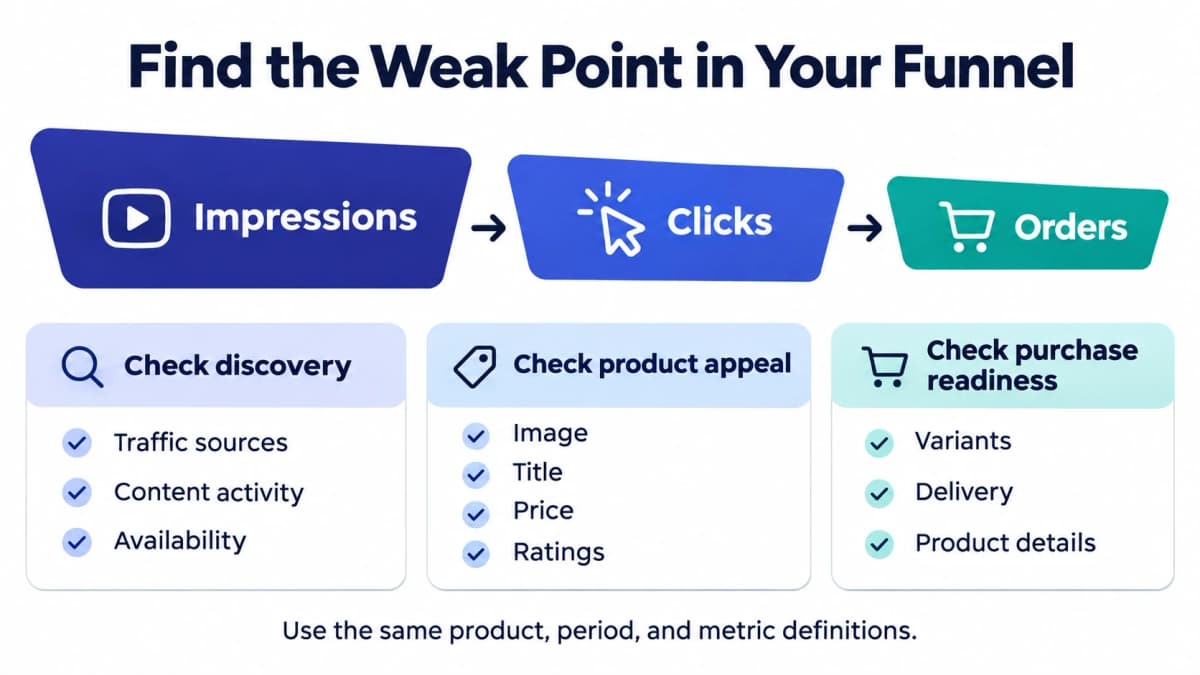
Follow the selected product and scenario through impressions, clicks, and orders. TikTok's product reporting provides traffic and conversion views; use the definitions shown for the selected report, including whether a metric uses page views or unique visitors.
Compare the same metric, population, and period. Do not calculate a conversion rate by combining a click count from one report with an order count using a different attribution window.
Check the Weakest Stage
| Observed change | Working hypothesis | Evidence to check |
|---|---|---|
| Fewer impressions | Fewer opportunities to discover the product | Traffic sources, content activity, listing availability |
| Lower click-through rate | The visible offer attracts less interest | Product card, image, title, displayed price, ratings, traffic mix |
| Lower click-to-order rate | More visitors hesitate after clicking | Variant availability, delivery information, product details, offer terms |
| Lower average order value | The mix or value of purchases changed | SKU mix, discounts, bundles, quantities per order |
These are investigation paths. A lower click-through rate, for example, could reflect a change in the audience being reached even when the image and title stayed the same. Editing the main image without checking traffic composition would leave that alternative explanation unresolved.
Read Counts Alongside Rates
Rates can look healthy while the business loses volume. In a hypothetical comparison using one consistent definition, 1,000 clicks producing 50 orders and 600 clicks producing 30 orders both yield a 5% click-to-order rate. Orders fell by 40% because fewer clicks reached that stage.
That observation directs attention upstream. It does not prove why clicks fell, and it does not justify an automatic discount. The seller should next inspect impressions, click-through performance, and traffic mix.
Small samples also deserve care. A change from two orders to one can produce a dramatic percentage movement with little evidence of a persistent problem. Keep the underlying counts visible before deciding how much weight to give a rate.
Check What Buyers Encounter
Inspect the current product experience as a buyer would. Confirm that the promoted variant is available, the pack size is clear, delivery information is understandable, and the content accurately describes what arrives.
Compare the timing of any issue with the sales change. A missing size discovered today may be important, but it cannot explain a decline that happened before the size became unavailable. Save dated observations so the explanation can be checked later.
Output: the weakest stage, its underlying counts, and a short list of explanations supported by dated evidence.
Step 4. Validate the Product Diagnosis
In the U.S. Seller Center, TikTok Shop Product Diagnosis organizes existing product analytics around changes, comparison benchmarks, and potential actions. Read the summary alongside the checks already completed, then verify each important finding against the selected product and reporting period.
Distinguish the Finding Types
The summary can include blocking risks, period-over-period factors, and gaps against comparable top-performing products. It displays up to 10 factor cards, so the visible list is not exhaustive. A suggested improvement should not automatically be described as the proven cause of a decline.
For each important card, write down three things:
- Observation: the metric or condition the card identifies.
- Explanation: the reason it may matter in this product's situation.
- Verification: the evidence still needed before choosing an action.
For instance, if a finding raises a pricing question, compare equivalent sizes and specifications. Check visible discounts, shipping terms, and the timing of changes. Track TikTok Shop competitor signals such as pricing, review momentum, and creator activity to test whether the market context supports the explanation. A cheaper competing item with a different pack size is a weak basis for changing the price. Compare similar products in the October 2026 U.S. TikTok Shop best-selling products report to see where the product's price sits within the ranked sample and which competing offers deserve a closer look. Match specifications and pack sizes, then check current offers before deciding whether a price adjustment is justified.
Interpret the Benchmark
Period comparison measures change against the product's own past. The benchmark compares its current position with a platform-selected peer reference. Benchmark values are visible, individual competitor identities are not, and sellers cannot customize the group. A stable product can still have a benchmark gap.
Use that gap to ask a narrower question. If a product trails a reference level, which operational difference can the team actually observe and address? Avoid treating an aggregate peer result as a promise that matching one visible attribute will produce the same sales.
Check AI-Assisted Explanations
Chat with AI supports follow-up questions, but TikTok labels generated content as reference material. Verify it against the report and business context.
A useful question is specific: “Which metric changed in the selected period, and what evidence distinguishes a traffic decline from a conversion decline?” Keep the response attached to the relevant product and dates. If the explanation does not match the observed data, retain the uncertainty and investigate further.
Output: a supported working diagnosis, the main alternative explanation, and the evidence required to choose between them.
Step 5. Take Action and Track Results
Choose a Focused Response
Resolve confirmed blocking issues first. Restoring a genuinely unavailable variant or correcting an inaccurate listing does not need to wait for a marketing experiment. For optimization work, select a change with a clear hypothesis and observable outcome.
Use a simple action log:
| Field | Illustrative entry |
|---|---|
| Observation | Product clicks fell while click-to-order rate held steady |
| Evidence | Comparable report periods and dated content records |
| Working explanation | Fewer product videos may have reduced discovery |
| Action | Resume a defined publishing schedule |
| Primary measure | Product clicks in the affected scenario |
| Supporting measures | Impressions, orders, GMV, content activity |
| Guardrails | Costs, refund behavior, inventory availability |
| Review | Next comparable complete period, with sample size checked |
This is a planning example. It does not predict that publishing more videos will recover sales. If the next review shows more impressions but no additional clicks, the team has learned where the hypothesis needs refinement.
Make the Review Interpretable
Record the change date, owner, and any simultaneous events. Keep price, promotion, and other controllable conditions stable when practical. When multiple urgent changes are necessary, document them rather than claiming the result came from just one.
Choose the review window based on the product's volume and the type of action. Daily monitoring can catch an availability problem quickly. Evaluating a creative or offer change may require a longer period with enough observations to avoid reacting to noise.
Compare both the target metric and the commercial outcome. More orders may be useful, but a discount that reduces contribution margin below an acceptable level needs a different decision. Use actual cost and settlement information for that assessment.
Output: a documented action, a review date, and a decision to continue, revise, or stop based on the evidence.
Conclusion
Effective TikTok Shop analytics follows a clear sequence: identify the sales change, compare selling scenarios, inspect the conversion funnel, validate the diagnosis, and track the result of a focused action. Start with the product that matters most to the business, keep comparison periods consistent, and use the evidence to decide whether the next priority is availability, traffic, conversion, or content. Review the commercial result alongside the headline sales metrics before expanding a successful change.
Turn Insights Into Action With Nexscope
Once the analysis identifies what needs attention, the next task may be researching competing offers, checking creator activity, or producing a new product video to test. Nexscope brings together ecommerce data and AI image and video tools to support that progression from research to creative execution.
Key Features
- Ecommerce data and market research: research products, prices, rankings, reviews, keywords, and competitors across supported marketplaces. For TikTok Shop, use available product, creator, video, and livestream signals to add context to the shop's own analysis.
- REST API and MCP access: connect supported data capabilities to the team's own applications, AI agents, and research workflows, so comparisons and briefs can use structured evidence.
- AI product video creation: turn product photos into videos and explore different presentation angles for the next content test.
- Product images and creative assets: create product image sets, lifestyle scenes, and supporting visuals to make product information clearer across listings and campaigns.
- Market reports and research insights: compare relevant products and creators to identify pricing questions, category patterns, and content opportunities worth investigating further.
Use Seller Center to evaluate the shop's own performance, add external research where a market comparison helps, and turn the resulting brief into a focused creative test. Keep the reporting period and data source attached to comparisons, and review generated assets for product accuracy before use.
Put Your TikTok Shop Insights to Work
Explore product, creator, and livestream data to guide your next research or content decision.
Explore TikTok Shop Data →Frequently Asked Questions
Where can sellers find TikTok Shop analytics?
Start in Seller Center and locate Analytics or Product Analytics. The current U.S. diagnostic workflow starts from Product Performance and leads to individual product diagnosis. Navigation labels can change, so follow the live interface. Choose a product and reporting period before interpreting its metrics, and keep those selections consistent throughout the investigation.
What is TikTok Shop Product Diagnosis?
Product Diagnosis organizes product performance into a summary of changes, relevant scenarios, risks, and improvement opportunities. It helps sellers decide what to investigate next. The practical follow-up is to check the underlying metrics, confirm that the explanation fits the reporting period, and record the business evidence behind any proposed adjustment.
Why can sales fall without an attention flag?
A decline alone does not guarantee a flag. The feature also depends on the offline diagnosis. Sellers should continue reviewing material changes even when no flag appears. Start with the amount lost, the product's commercial importance, and any availability issues, then investigate whether the movement persists across a suitable comparison window.
What is the difference between CTR and CTOR?
Click-through rate concerns the progression from exposure to a click. Click-to-order rate concerns progression from a click to an order. Always check the selected report's exact definitions and denominators before calculating or comparing either. Read the counts alongside the percentages, because a stable conversion rate can coexist with fewer clicks and orders.
Can sellers choose their own benchmark products?
The platform-defined diagnostic benchmark cannot currently be customized. Sellers can separately build a research set of competing products with similar specifications, prices, and markets. Keep that external comparison distinct from the platform benchmark, and explain the selection criteria. A small handpicked set can answer a focused question without representing the entire category.
Can TikTok Shop analytics show competitor sales?
Seller Center supplies the seller's own account performance and supported aggregate comparisons. External research tools may provide competitor observations or sales estimates, depending on the source. Label estimates clearly, record the relevant period, and check comparable product specifications. Competitor sales signals cannot establish another seller's private click-to-order rate or exact profitability.
Sources
- TikTok Shop Seller University. New Product Diagnostics Feature Launch. Updated November 12, 2026.
- TikTok Shop Seller University. How to Use Product Analytics. Updated September 11, 2025.
- TikTok Shop Seller University. How to Deep Dive with Sales Analytics. September 10, 2025.
- Nexscope. TikTok Shop Data catalog and Product, Creator, and Video Analytics documentation. Accessed November 13, 2026.